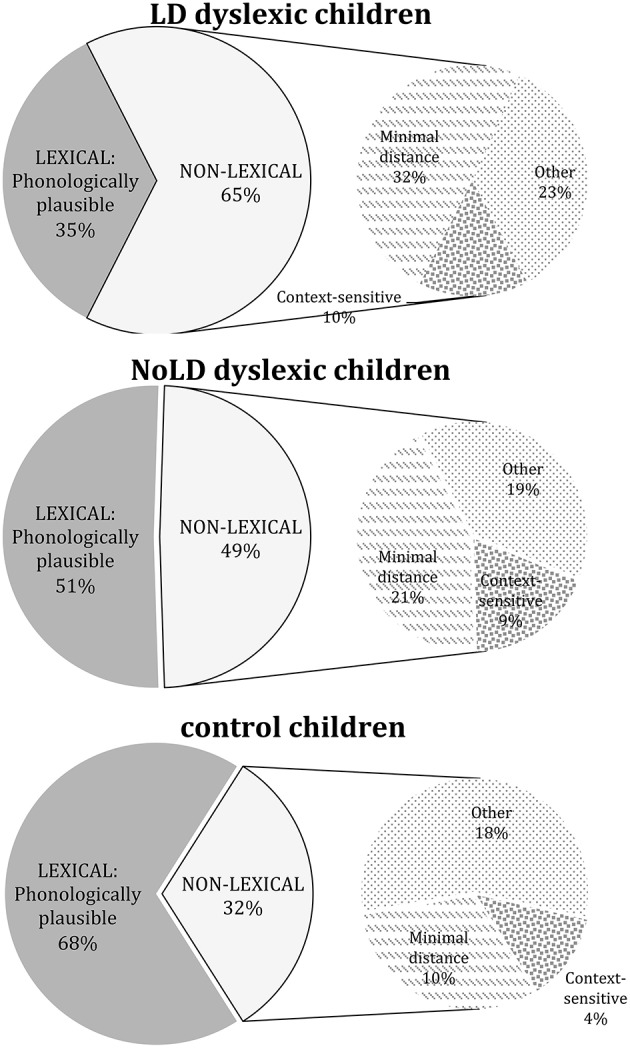
Figure 2.

Left side of figures reports the percentage of lexical and non-lexical errors, respectively, in LD, NoLD dyslexic children, and control participants. Right side of figures represents the proportion of minimal distance, other and context sensitive errors among non-lexical errors in the three groups of participants.
