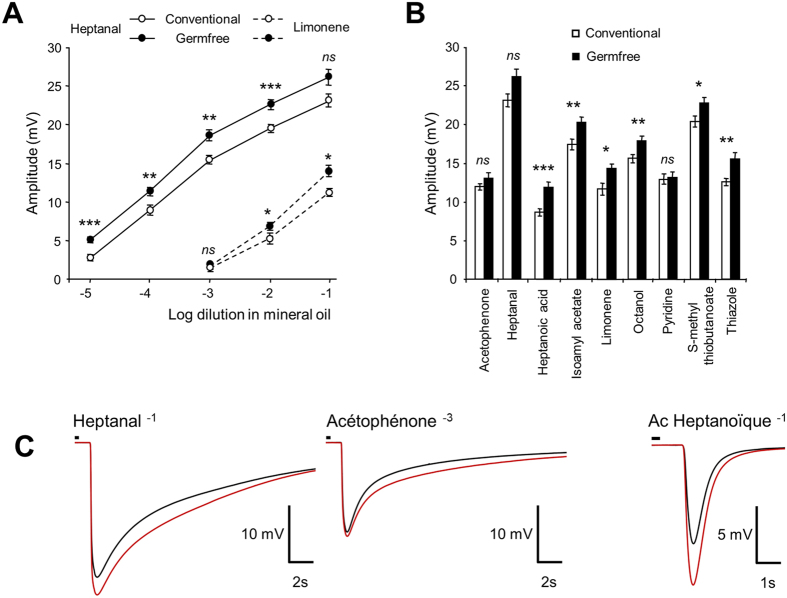
Figure 3. Global increase of responses to odorants recorded by EOG in germfree animals.
(A,B) EOG responses to various odorants in conventional and germfree animals. Values represent the mean of peak amplitudes ± SEM (n = 12) (*P < 0.05; **P < 0.01; ***P < 0.001). (C) Average traces for 3 odorants from conventional (black) and germfree (red) animals. Small black line on top of recordings indicates odorant stimulation.

