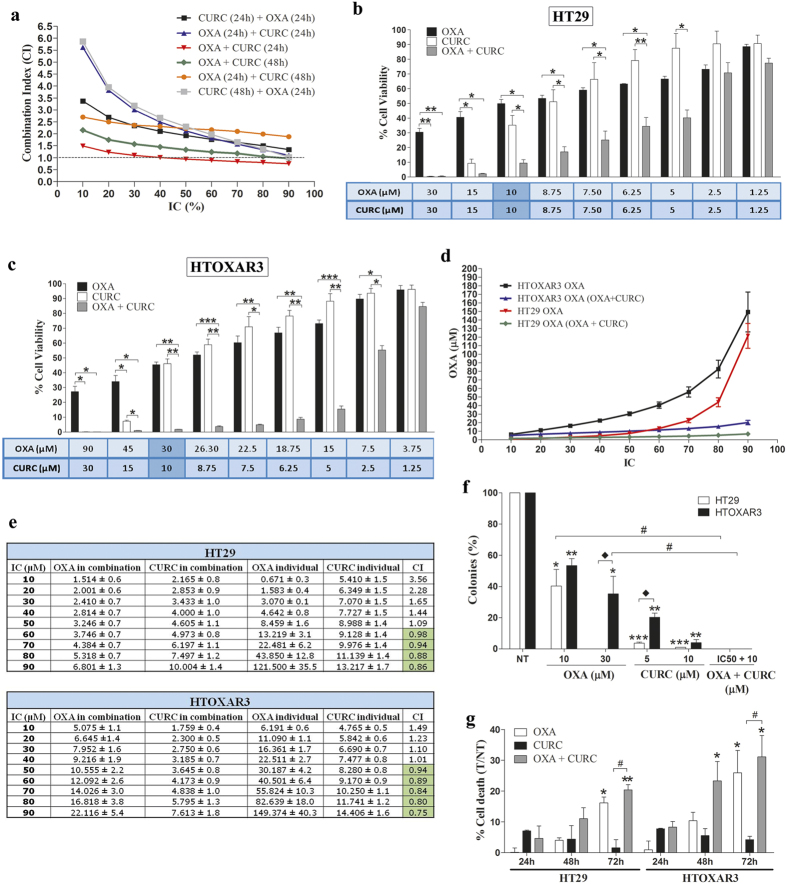
Figure 3. Combination of OXA and Curcumin in OXA-sensitive and –resistant CRC cell lines.
(a) Graphic representation of the Combination Index (CI) values corresponding to different OXA plus Curcumin (CURC) treatment schedules in the HTOXAR3 cell line. (b) Bar graphs representing mean ± SEM percentage of cell viability after a 24-hour treatment with OXA, Curcumin or their concomitant combination at the indicated doses in HT29 and HTOXAR3 cells (c). *p-value < 0.05; **p-value < 0.01; ***p-value < 0.001 relative to the indicated treatment condition. (d) OXA doses (mean ± SEM) corresponding to indicated inhibitory concentrations (IC) in HT29 and HTOXAR3 cells as a single agent or when combined with Curcumin concomitantly for 24 h. (e) OXA and Curcumin doses (mean ± SD) corresponding to the indicated inhibitory concentrations (IC) when given as single agents or in a 24 h-concomitant schedule in HT29 and HTOXAR3. CI represents the combination index values in each case. Synergistic values (CI < 1) are highlighted in green. (f) Bar graph representing the percentage (mean ± SEM) of colonies in HT29 and HTOXAR3 cells after 24 h of the indicated treatments. *p-value < 0.05; **p-value < 0.01; ***p-value < 0.001 relative to NT (Non-treated cells). #p-value < 0.05 relative to OXA individual treatment. *p-value < 0.05 as compared to HT29. (g) Bar graph representing the percentage (mean ± SEM) of dead cells after 24, 48 and 72 h of treatment with OXA, Curcumin or their combination (as compared to non-treated controls) at their corresponding IC50 doses in HT29 and HTOXAR3 cell lines. *p-value < 0.05; **p-value < 0.01, relative to NT. #p-value < 0,05, relative to Curcumin individual treatment.

