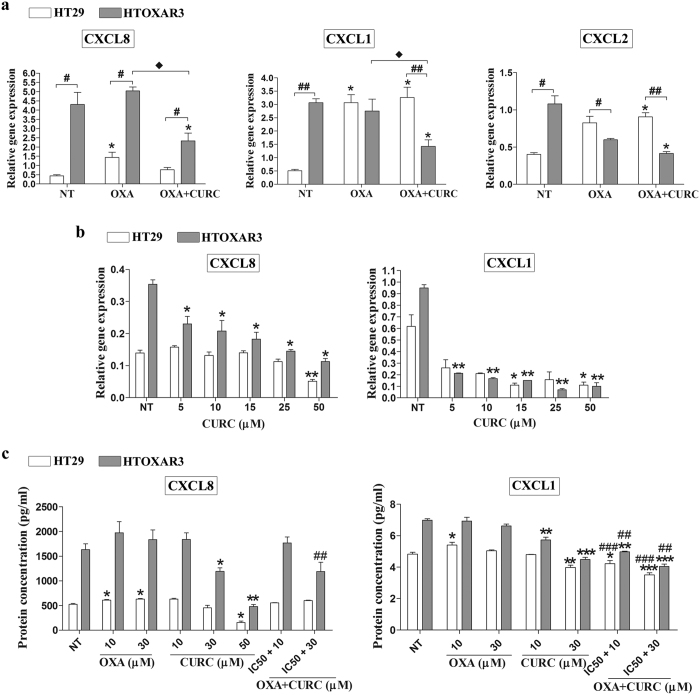
Figure 6. CXCL1, CXCL8 and CXCL2 gene expression and CXCL1 and CXCL8 secreted protein levels after treatment with OXA, Curcumin or both.
(a) Bar graphs illustrating relative gene expression levels (mean ± SEM) of the indicated chemokines in non-treated (NT) and after OXA or OXA plus Curcumin (CURC) treatment at IC50 doses in HT29 and HTOXAR3 cells. Gene expression levels of β-actin were used as endogenous control. *p-value < 0.05 relative to NT, #p-value < 0.05; ##p-value < 0.01, relative to HT29. ** p-value < 0.05 relative to OXA. (b) Changes in chemokines’ gene expression after treatment with Curcumin at indicated doses. (c) Graph bars showing levels of secreted chemokines (mean ± SEM) measured by enzyme-linked immunosorbent assay (ELISA) in the supernatants of treated cells as indicated. *p-value < 0.05; **p-value < 0.01; ***p-value < 0.001 relative to NT. ##p-value < 0.01, ###p-value < 0,001 relative to OXA. Results were obtained from at least 3 independent experiments.

