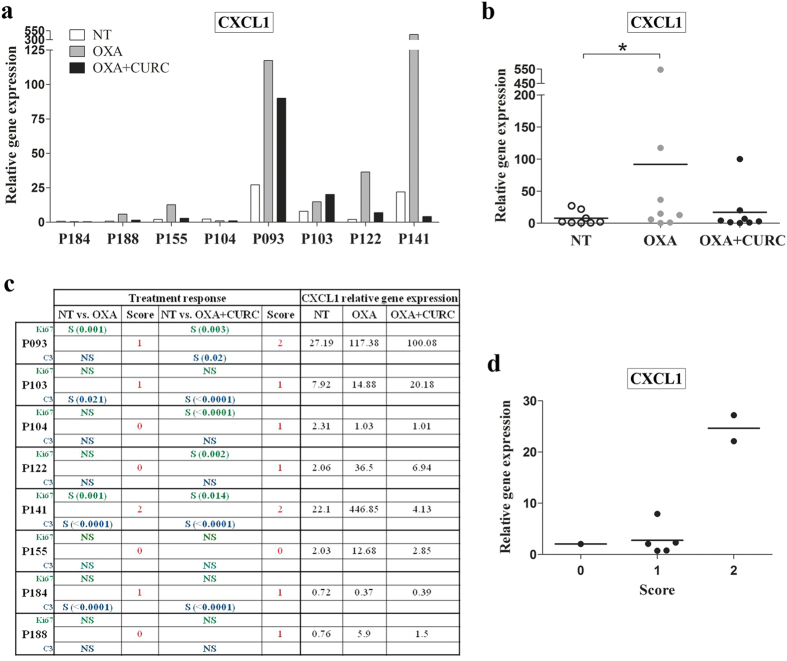
Figure 8. CXCL1 gene expression in explant cultures of patient-derived tissues after treatment with OXA or OXA + Curcumin.
(a) Bar graph illustrating CXCL1 expression levels in 8 FFPE samples from explant cultures of CRC patients-derived liver metastases, that were treated with DMSO (NT), OXA or OXA plus Curcumin (CURC) for 24 h. (b) Scattergram reporting the expression levels of CXCL1 in NT, OXA or OXA plus Curcumin treated tissue explants. Horizontal lines represent mean values. (c) Table showing significative (S) or not significative (NS) changes in ki-67 (green) and cleaved caspase 3 (C3, blue) staining. Score 2 meant that ki-67 decreased and cleaved caspase increased significantly after the indicated treatment; score 1 meant that ki-67 decreased or cleaved caspase increased and score 0 meant that neither of them was changed. CXCL1 gene expression changes after NT, OXA or OXA + Curcumin treatment are also shown. (d) Scatter plot showing CXCL1 expression according to score values. Horizontal lines represent mean values. *p-value < 0.05 relative to NT (Wilcoxon test).

