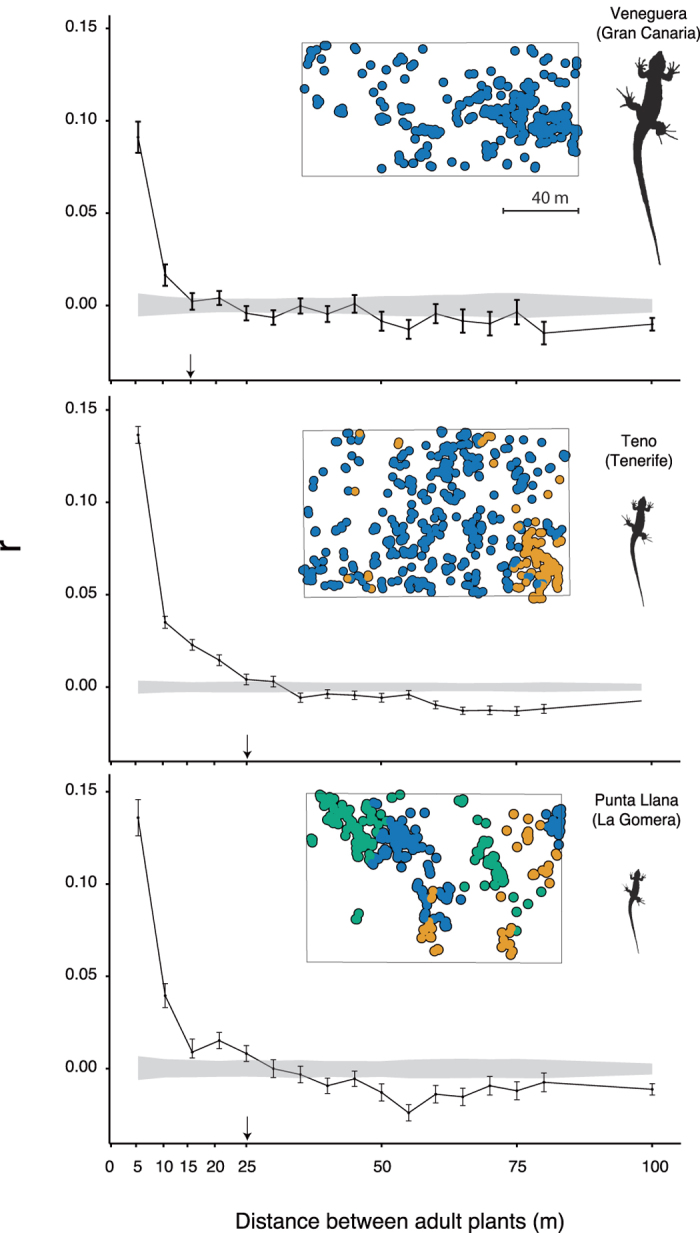
Figure 3. Spatial patterns of fine scale genetic structure of Neochamelea pulverulenta.

Autocorrelograms showing the variation of genetic similarity (rij) with geographic distance among pairs of adult plants (see Fig. S3 for results with sub-adults). Grey areas represent the 95% confidence intervals for the null hypothesis calculated by permutations of the plant spatial coordinates. Arrows indicate the first distance class at which the spatial autocorrelation becomes non-significant. Insets show the 1-ha plots maps indicating the distribution of adult plants (dots). Colours indicate the assignment of each plant to genetic clusters inferred according to the posterior probability of cluster membership (see Methods). All the study plots are represented at the same spatial scale.
