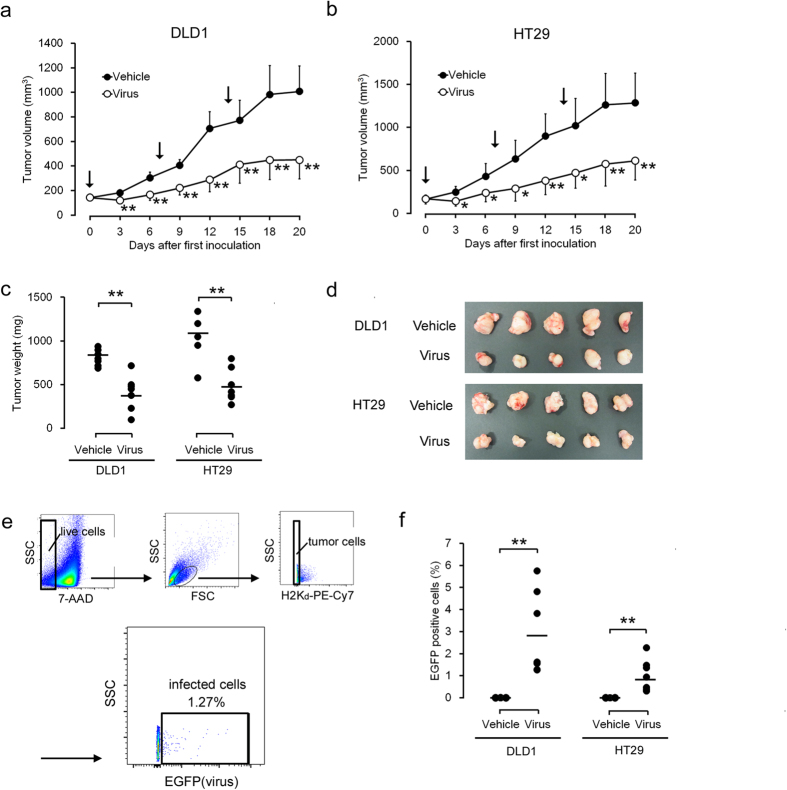
Figure 3. Antitumor effects of rMV-EGFP-SLAMblind in vivo.
Growth curves of DLD1 (a) and HT29 cells (b) in vivo. A total number of 106 DLD1 and HT29 cells were injected subcutaneously into seven SCID mice each, and the tumour sizes were measured every 2 or 3 days. Arrows indicate the days upon which the mice were injected intratumorally with rMV-EGFP-SLAMblind at 106 TCID50/mouse (days 0, 7, and 14). Each datum represents a mean ± SD (n = 7). *p < 0.05, **p < 0.01 compared with the vehicle-treated control on Welch’s t test. (c) Antitumor effects conferred by rMV-EGFP-SLAMblind. All mice were euthanized on day 20 and their tumours weighed. The bar indicates the mean average for each group. (n = 7). **p < 0.01 compared with the vehicle-treated controls on Welch’s t test. (d) Representative photographs of a tumour in each treatment group. (e) Flow-cytometric analysis of live virus-infected tumour cells. All plots are density plots and fluorescent intensities were plotted on bi-exponential axes. (f) The plots indicate the proportion of EGFP-positive cells in each mouse (n = 7 in each group), and the bar indicates the mean for each group. **p < 0.01 compared with the vehicle-treated control on Welch’s t test.

