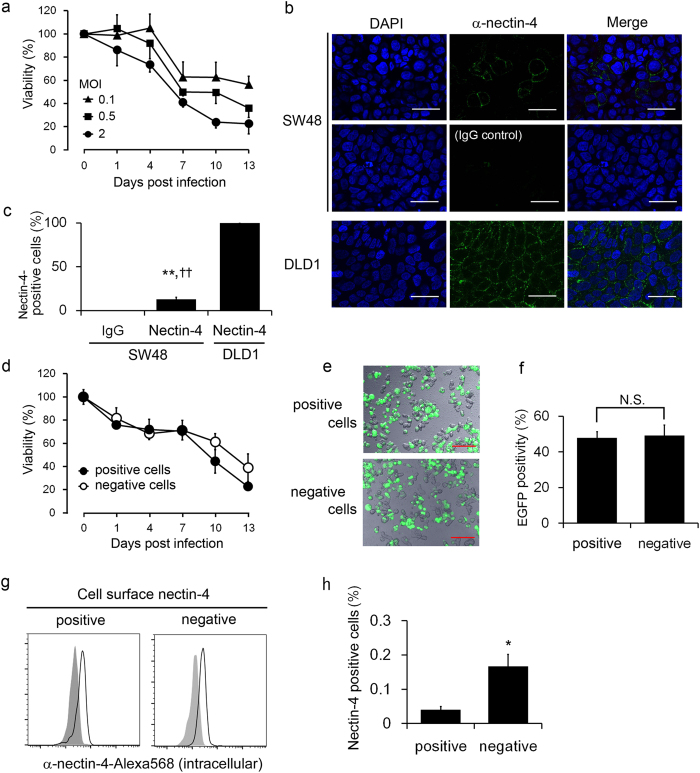
Figure 5. Unique nectin-4 expression in SW48 cells.
(a) Changes in cell viability in SW48 cells after rMV-EGFP-SLAMblind inoculation at different MOIs. A WST assay was conducted on the indicated dpi. Each datum represents the mean ± SD of three independent experiments. (b) Immunocytochemical analysis of SW48 cells. Cells were stained with anti-nectin-4 pAb, followed by Alexa-Fluor-488-conjugated anti-goat IgG Ab. The cells were then fixed, stained with Hoechst 33342, and observed under a fluorescence microscope. Isotype IgG was used as the negative control. Shown are representative data of three independent experiments. Original magnification, 60× objective lens. Bar, 30 μm. (c) The graph shows the proportions of Alexa-Fluor-488-positive cells as the means ± SD of five randomly selected microscopic fields. **,††p < 0.01 compared with the isotype-IgG-stained control and DLD1 cells on Welch’s t test, respectively. (d) WST assay of sorted SW48 cells. A WST assay was conducted using either nectin-4-positive or nectin-4-negative cells after cell sorting. (e) Representative fluorescence microscopic data of three independent experiments. Cells were inoculated with rMV-EGFP-SLAMblind at MOI 2 for 72 h. Original magnification, 20× objective lens. Bar, 100 μm. (f) The graph shows the proportions of EGFP-positive cells of five randomly selected microscopic fields. The values are the means ± SD of three independent experiments. N.S., not significant on Welch’s t test. (g) Flow-cytometric analysis of intracellular nectin-4 in SW48 cells. Cell-surface and intracellular nectin-4 expression was detected with mouse anti-nectin-4 mAb (clone N4.61) and goat anti-nectin-4 pAb, respectively. Each histogram indicates the intracellular nectin-4 level in either the nectin-4-positive or nectin-4-negative population. The grey histogram indicates the IgG control for each fraction. Shown are representative data of three independent experiments. (h) Flow-cytometric analysis of cell-surface nectin-4 expression in a short-term culture of SW48 cells. Nectin-4-negative SW48 cells were sorted and cultured in FBS-containing medium for 2 h, and the gain of surface nectin-4 expression was examined. The negative control cells were stained with nectin-4 Ab without culture. The data represent the means ± SD of the nectin-4-positive cells in three independent experiments. *p < 0.05 on Welch’s t test.

