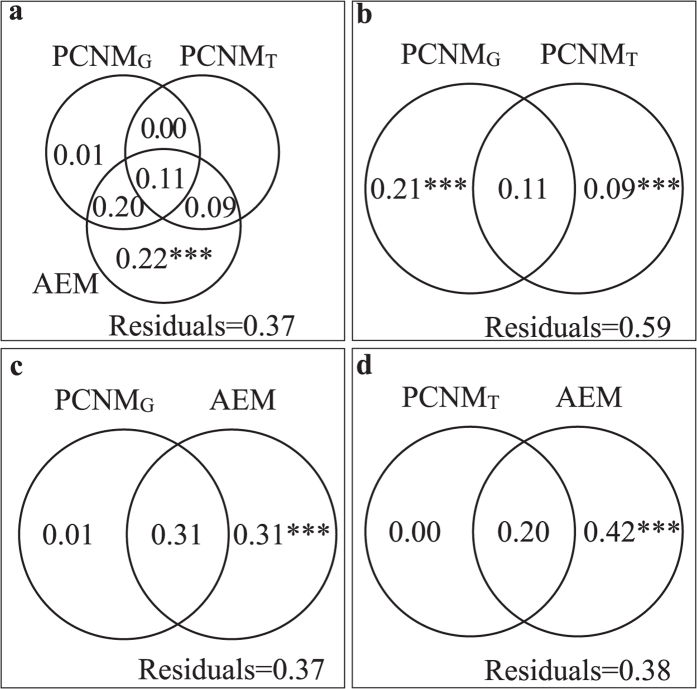
Figure 4.
Venn-diagrams showing the results of variation partitioning performed on (a) Geographical model (PCNMG), Topographic model (PCNMT) and directional spatial model (AEM), (b) PCNMG and PCNMT, (c) PCNMG and AEM, (d) PCNMT and AEM for benthic diatom metacommuntiy in the study area. Variation explained uniquely and jointly, and the unexplained fractions were shown as the number in each part of the figures (total variation = 1). The significance of each testable fraction was expressed as *P < 0.05, **P < 0.01, ***P < 0.001.

