
Figure 2. Experience effects of the enjoyment ratings.
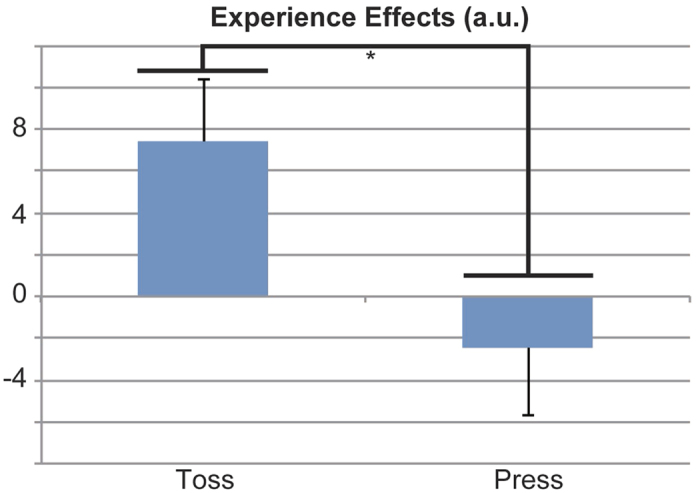
Experience effects are shown for the ball-toss run (Toss) and the button-press run (Press). Experience effects were calculated as (experience [high-frequency enjoyment – normal-frequency enjoyment] – expectation [high-frequency enjoyment – normal-frequency enjoyment]) for the two runs (ball-toss and button-press). Thus, experience effects ranged from −200 to 200. There was a significant difference between experience effects (p = 0.014; paired t-test). a.u., arbitrary units.