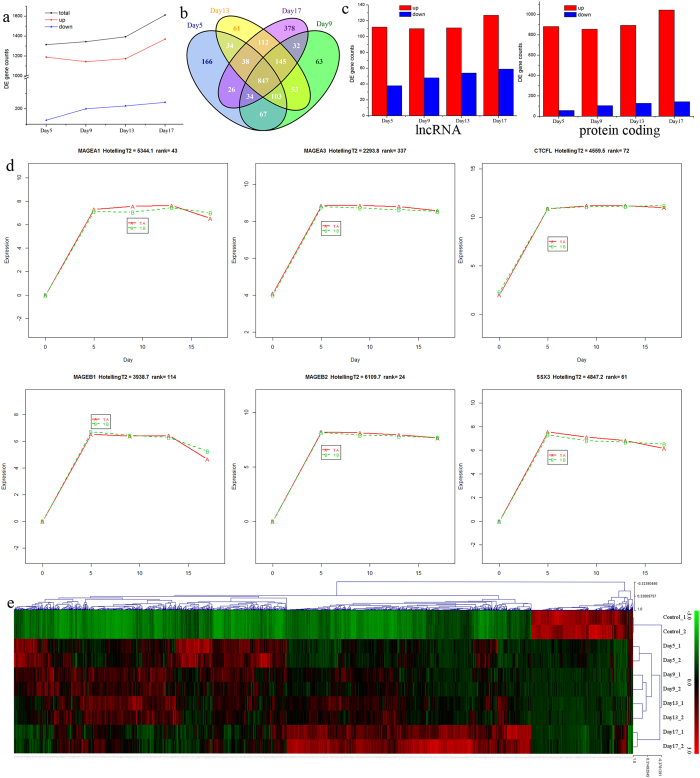
Figure 1. Dynamic transcriptome changes induced by 5-Aza-CdR treatment.
(a) The number of differentially expressed genes across different time points. (b) Venn diagram showing overlapped differentially expressed genes found in each time point. (c) The number of up and down regulated genes found in the two RNA types: protein coding RNAs and lncRNAs. (d) Tumor suppressor gene expression pattern. (Y axis indicates normalized expression, X axis indicates different 5-Aza-CdR exposure time, A and B indicated two replicates) (e) Hierarchical clustering of differentially expressed genes.

