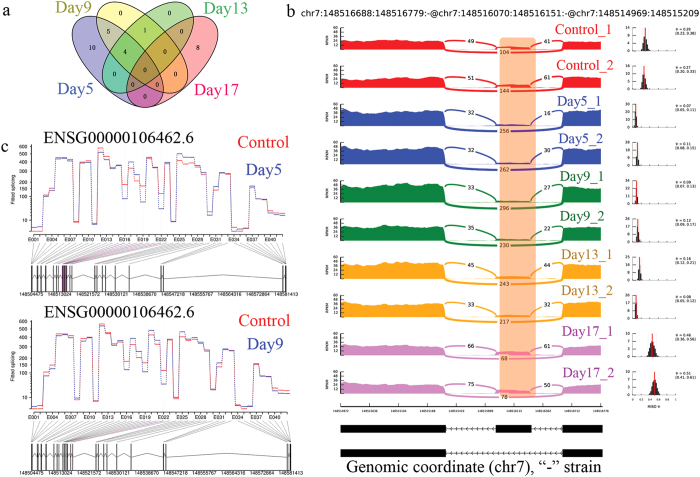
Figure 3. Exon recognition changes induced by 5-Aza-CdR treatment.
(a) Venn diagram showing overlapped differentially expressed skipped exon events found in each time point. (b) Sashimi plot showing the expression changes of EZH2 exon skipping (skipped exon was highlighted with orange rectangle) events at each time point. (ΔΨ > 0.15) (c) Visualization of differentially expressed exons found in EZH2 after 5, 9, 13, and 17 days treatment (differentially expressed exons were highlighted in red).

