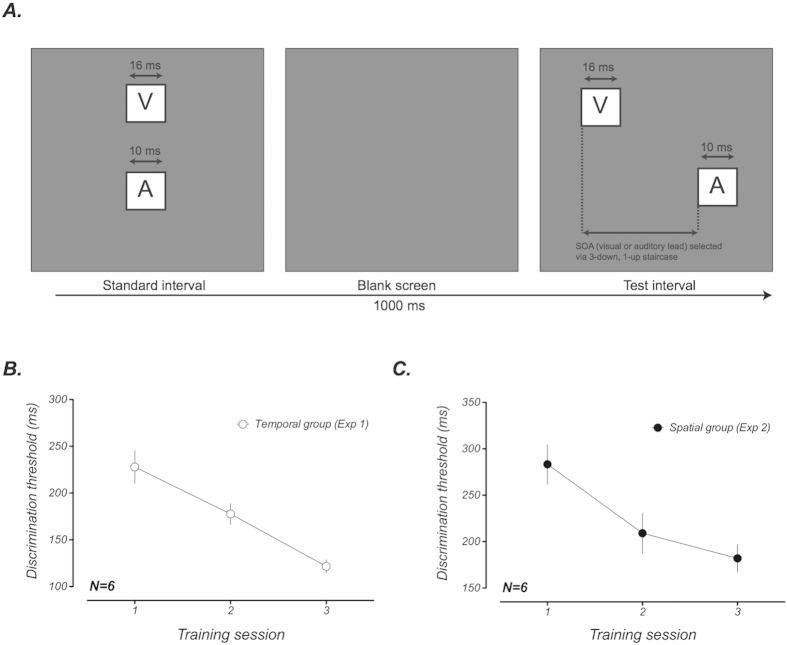
Figure 2. Schematic diagram of procedure for audiovisual simultaneity discrimination task and group-averaged learning curves.
(A) Participants were required to discriminate whether a simultaneous audiovisual stimulus (the standard interval) was presented in the first or second interval. In the comparison interval, auditory and visual stimuli were separated by a stimulus onset asynchrony determined by a staircase procedure. Participants in both the temporal (B) and spatial (C) integration experiments improved on this task over the course of training. Error bars represent ± 1 standard error across participants.

