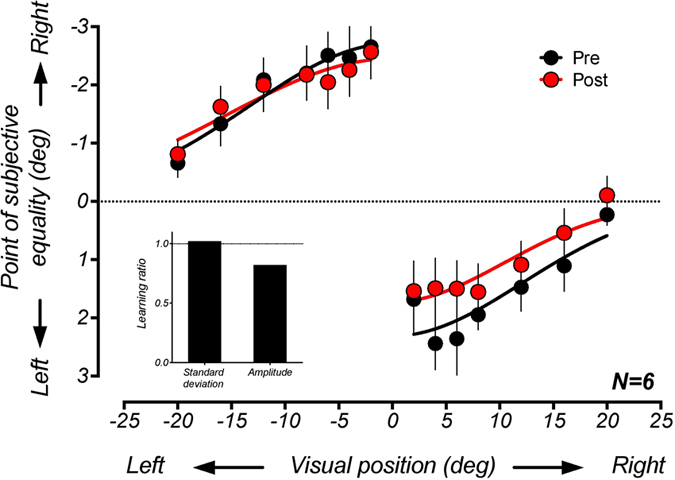
Figure 4. Group-averaged ventriloquist effects as a function of the position of the visual stimulus before and after training.

Unlike the case of temporal integration, training did not appear to narrow the window of spatial integration. There was, however, an overall amplitude reduction of the ventriloquist effect, which was more pronounced for conditions where the visual stimulus was positioned to the right of the midline. To quantify this reduction in a similar manner to Experiment 1, separate Gaussian functions were fitted to the conditions where the visual stimulus was positioned to left and right of the midline (pre left: R2=0.96, post left: R2 = 0.89, pre right: R2 = 0.82, post right: R2 = 0.89). The best-fitting values for left and right conditions were then averaged to produce composite learning ratios for the standard deviation and amplitude, and these values are plotted in the inset of the figure. While there was a small decrease in the amplitude of the Gaussian fit following training, there was no change in the standard deviation (learning ratio = 1). Error bars represent ± 1 standard error across participants.
