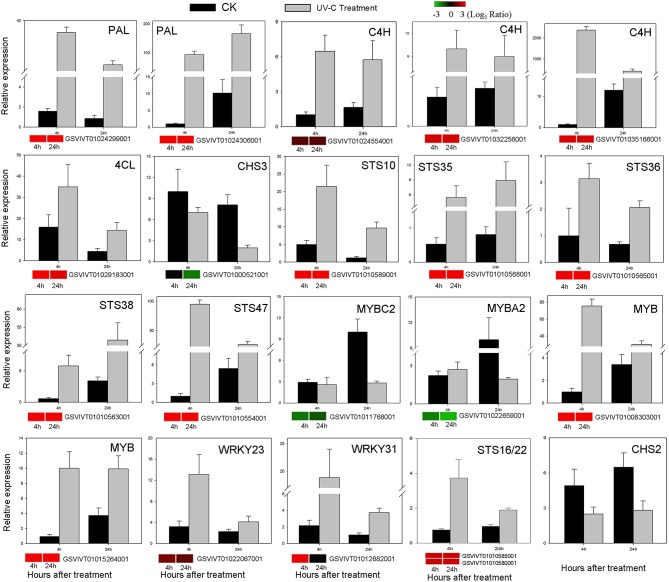
Figure 7.
Verification of RNA-Seq results by qRT-PCR analysis of the expression of 20 genes. Histograms represent abundance assessed by qRT-PCR data, reported as means ± SE of two biological replicates (each biological replicate for three technical replicates). Heat maps represent changes in gene expression. The color scale represents relative expression levels, with red denoting up-regulation, green denoting down-regulation and black denoting no change.

