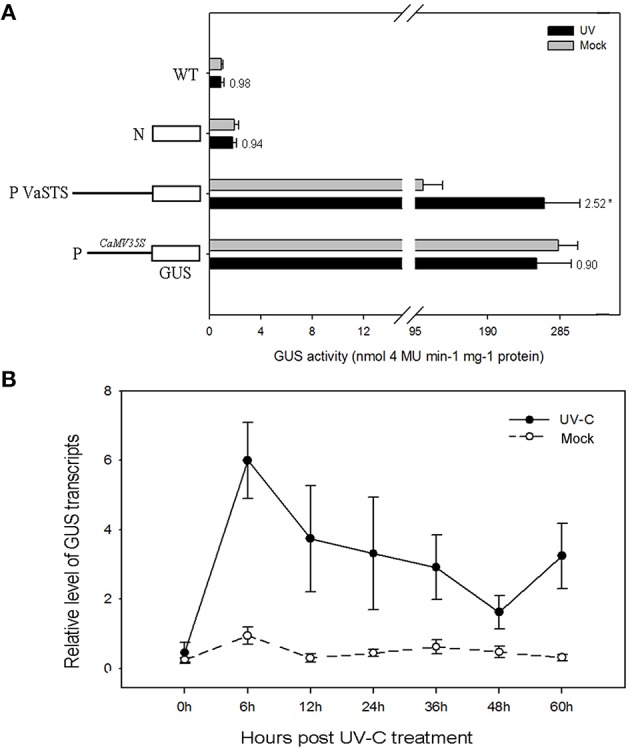
Figure 8.

(A) Histochemical analysis of GUS (β-galactosidase) activity after UV-C treatment of transiently transformed tobacco leaves carrying the GUS coding region fused to the VaSTS promoter. Numbers above the bars indicate the GUS activity fold of UV-C treated GUS activity relative to that of mock-inoculated sample, and its significant difference was assessed by a one-sided paired t-test (P < 0.05 [*]). (B) Activity of the VaSTS promoter in tobacco at different time points following UV-C irradiation was determined by quantitative real-time RT-PCR. GUS transcript accumulation was monitored in mock-treated leaves (dashed lines) and UV-C treated leaves (solid lines). Transcript levels were expressed as relative values normalized to the transcript level of the ubiquitin gene. Results are means of triplicate experiments; error bars indicate SD.
