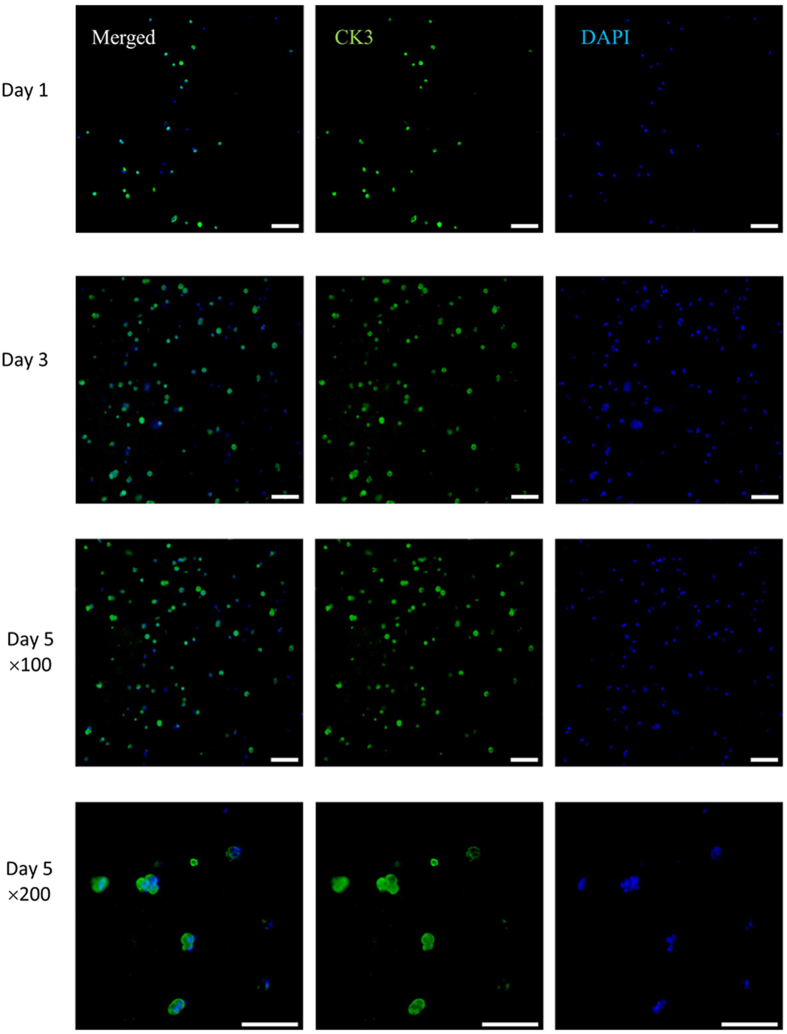
Figure 8. Specific marker protein expression of printed cells within constructs incubated with medium containing 66.7% sodium citrate (C/A, mole ratio, %).
Micrographs show fluorescent staining of CK3 (green) and nuclei (blue) of HCECs within the constructs after culturing for 1, 3, and 5 days (scale bar, 100 μm). (For the interpretation of the references to colour in this figure legend, the reader is referred to the web version of this article.)

