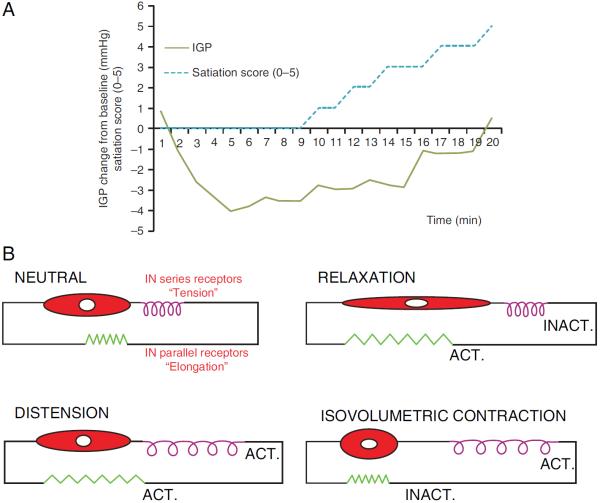
Figure 2.
(A) Example of intragastric pressure response and satiation score evolution during intragastric nutrient infusion. Nutrient infusion induces an initial drop in pressure, followed by gradual recovery associated with rising satiation scores. (B) Schematic conceptual model of gastric mechanoreceptors, relative to the muscular compartment. The four panels represent the modelled differential behaviour of `in series' tension receptors and `in parallel' elongation receptors during distension or contraction.

