


Figure 3.
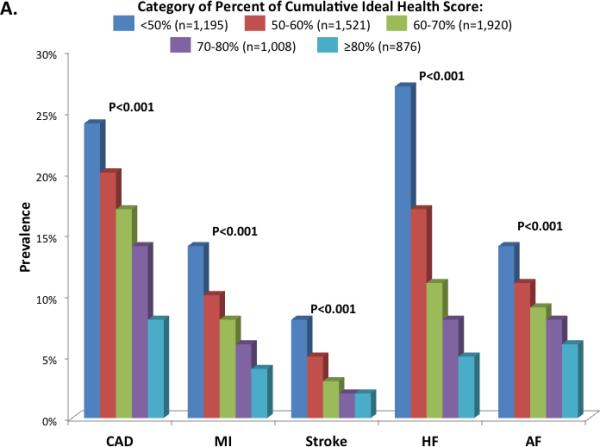
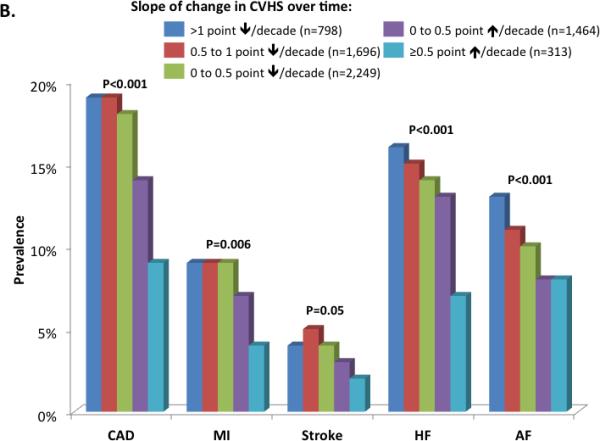
Prevalence of cardiovascular diseases by categories of percent cardiovascular health score (CVHS) attained through mid-life and late-life (Panel A) and by categories of change in CVHS per decade follow-up (Panel B). Prevalence estimates and P values are adjusted for age, gender, race, and Field Center.