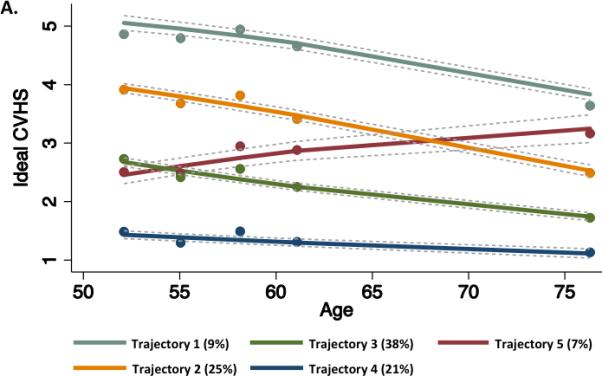
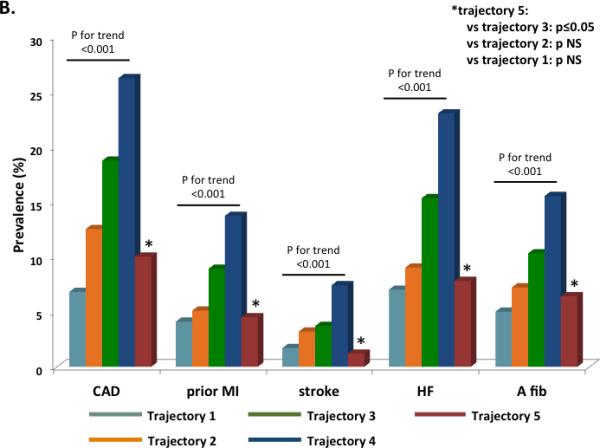
Figure 4.


(A) Trajectories of CVHS over the 25 year period of the ARIC study. Percentages in the figure legend refer to population prevalence. (B) Prevalence of cardiovascular diseases by trajectory of CVHS. Prevalence estimates and P values are adjusted for age, gender, race, and Field Center.
