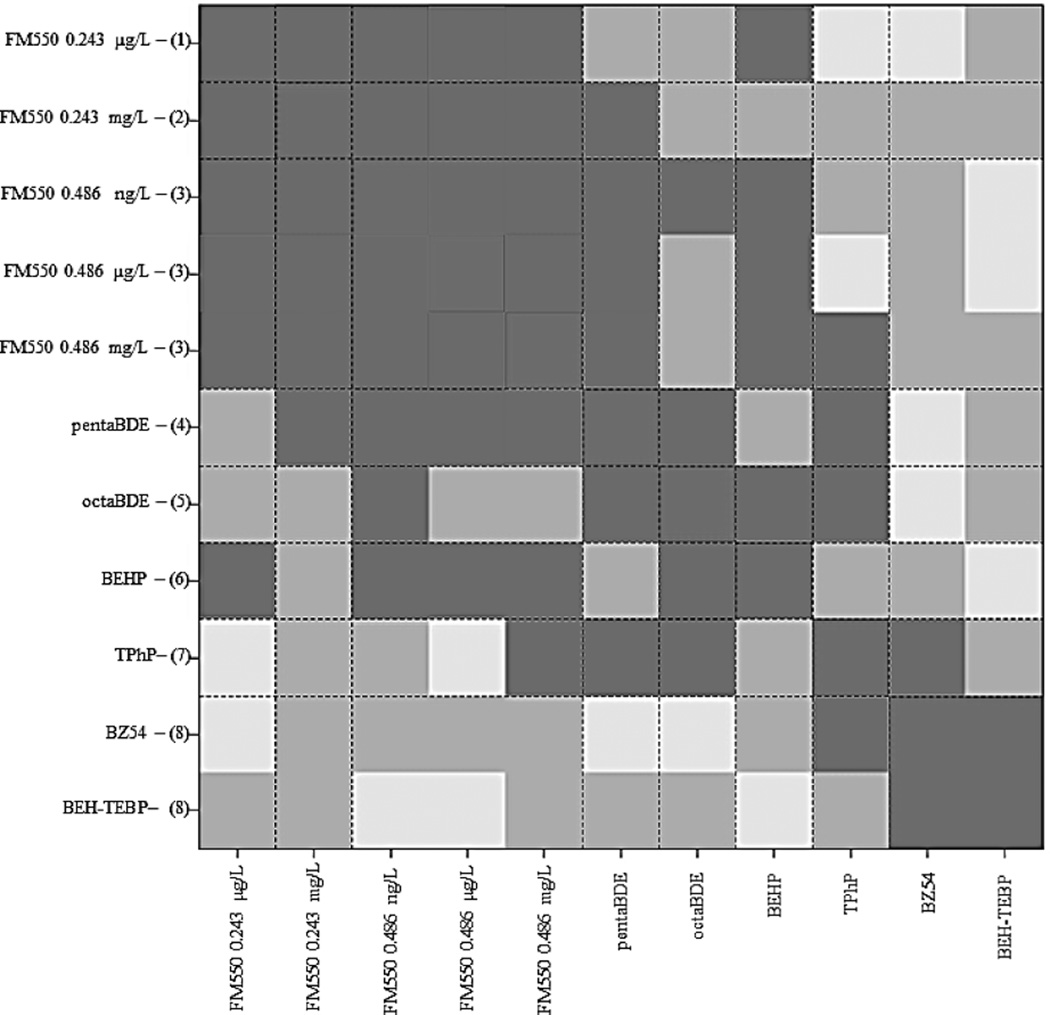
Figure 4.
HOPACH cluster analysis of chemical profiles shows visual representation of the corresponding ordered distance matrix. Darker colored squares indicate more similarity. Clusters are numbered 1–8 on the y-axis. Three FM550 concentrations were significantly similar (cluster 3), as were BZ54 and BEH-TEBP (cluster 8).

