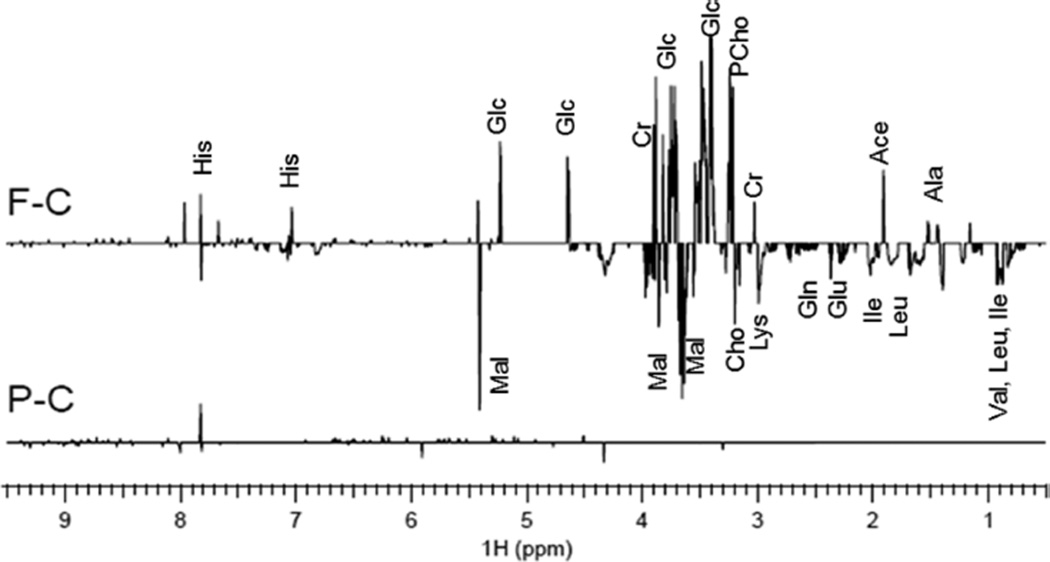
Figure 5.
1H NMR t test filtered difference spectra showing metabolomics changes in Daphnia exposed to 1/10 LC50 FM550 (F–C) or pentaBDE (P–C) as compared to control. The t test filtered difference spectra were obtained using 7 replicates for each class. Abbreviations: acetate (Ace), alanine (Ala), choline (Cho), creatine (Cr), glucose (Glc), glutamate (Glu), glutamine (Gln), histidine (His), isoleucine (Ile), leucine (Leu), lysine (Lys), malate (Mal), phosphocholine (PCho), and valine (Val). Spectra were t test filtered difference and include the p-values (less than 0.05).

