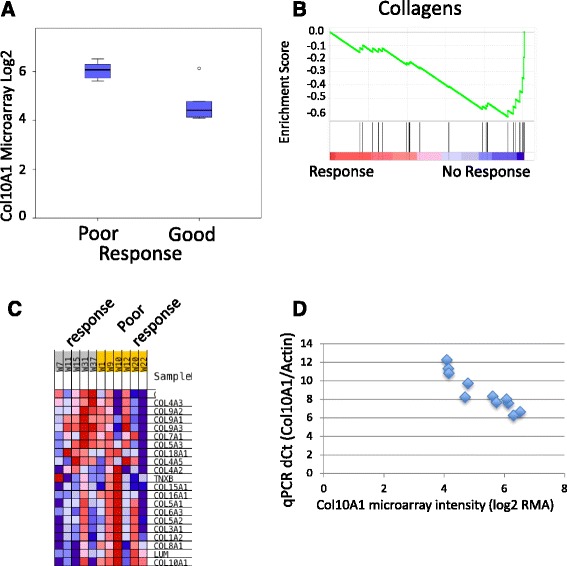
Fig. 2.

Association of colXα1 expression with NAC response. a Box plot of the Col10A1 probeset on the Affymetrix HTA 2.0 microarray distinguishes good and poor responding ER+/HER2+ breast tumors. The one outlier on the array, has an intermediate colXα1 IHC score of 1. b Gene Set Enrichment Analysis reveals enrichment of the Gene Ontology (GO) category, collagens, in pCR resistant ER+/HER2+ breast tumors. Each black line represents one gene in the GO collagen gene set. c Heat map of mRNA expression changes for all measured collagens on the microarray. d qPCR of Col10A1 mRNA expression correlates with the microarray data
