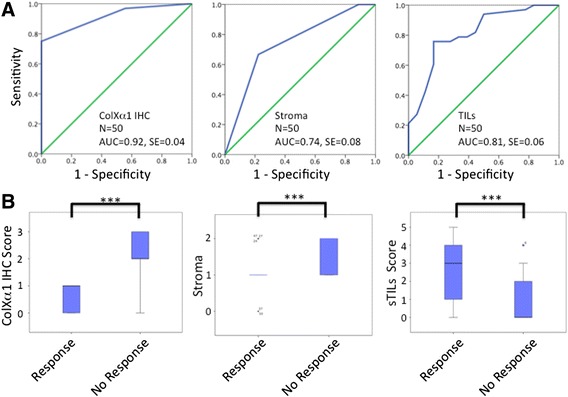
Fig. 4.

ColXα1 IHC scoring is strongly associated with NAC response. a ROC analysis of colXα1 IHC scores, stroma scores, and percent TIL. AUC = Area Under the Curve, SE = Standard Error. b Stroma and sTIL scores did not distinguish responders as strongly as colXα1 IHC. Box and whisker plots of each parameter show distinct separation between tumors that responded to NAC and those that with no response. *P < 0.05, ***P < 0.001
