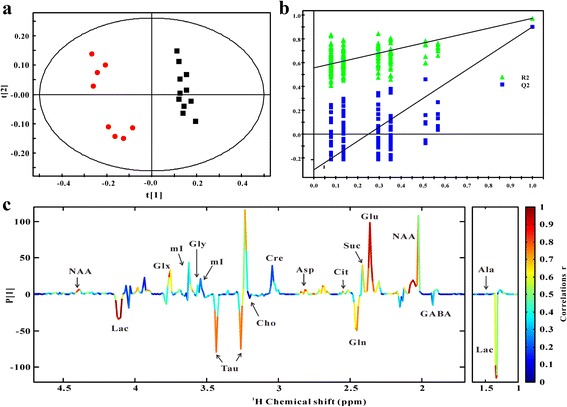
Fig. 4.

PLS-DA score plot (a) and validation plot (b) based on the 1H NMR spectra of hippocampus samples obtained from db/db mice (red circle, n = 7) and WT mice (■, n = 11). The coefficient-coded loading plot (c) corresponding to PLS-DA revealing the metabolites with large intensities responsible for the discrimination of the corresponding score plot
