
Fig. 5.
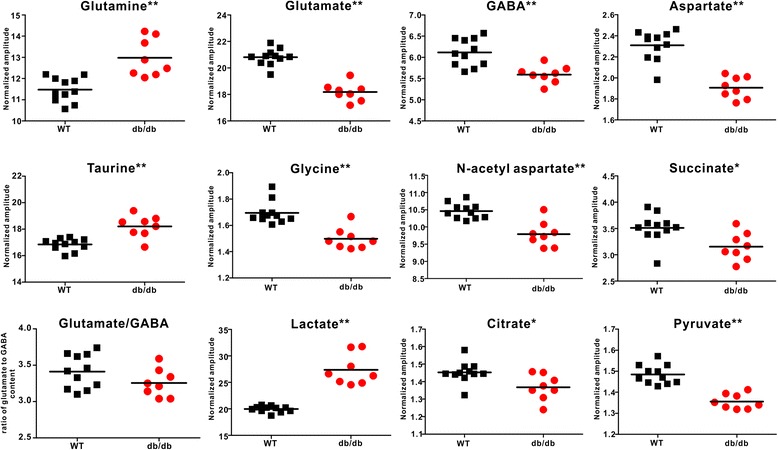
Changes in metabolite levels in the hippocampus of db/db mice with cognitive decline (red circle, n = 7) and WT mice (■, n = 11) obtained from NMR-based metabonomics. Significant level: * P < 0.05, ** p < 0.01
Official websites use .gov
A
.gov website belongs to an official
government organization in the United States.
Secure .gov websites use HTTPS
A lock (
) or https:// means you've safely
connected to the .gov website. Share sensitive
information only on official, secure websites.
Changes in metabolite levels in the hippocampus of db/db mice with cognitive decline (red circle, n = 7) and WT mice (■, n = 11) obtained from NMR-based metabonomics. Significant level: * P < 0.05, ** p < 0.01