
Fig. 3.
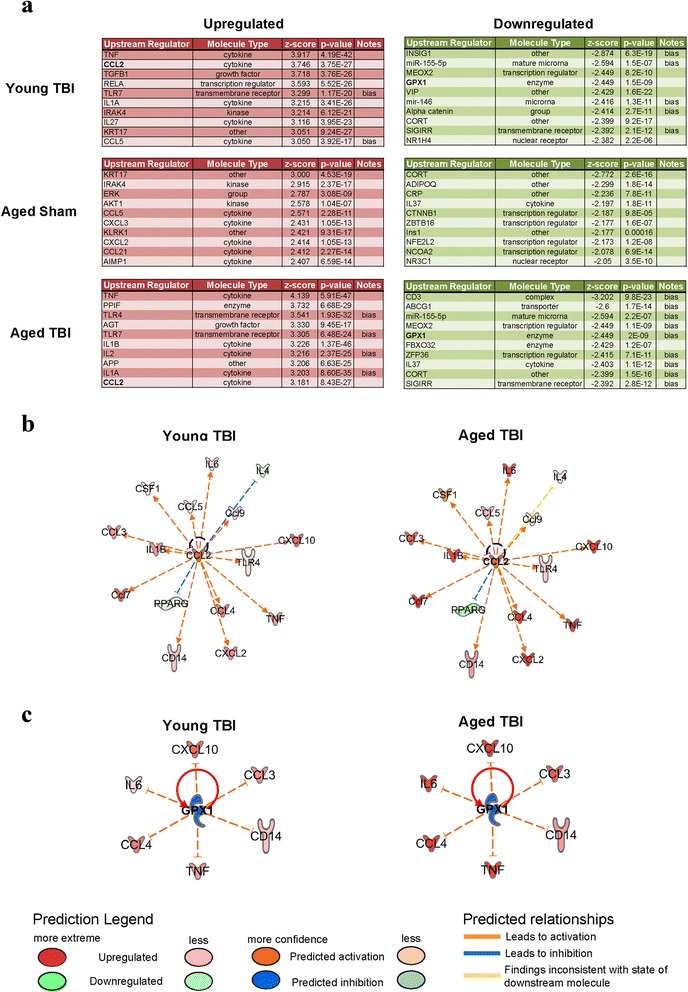
IPA upstream analysis displays heterogeneous regulatory components associated with inflammatory response. Gene array data were loaded into IPA software; genes with a fold change (relative to young sham) ≥1.5 or ≤−1.5 were included for upstream regulator analysis. a Upregulated and downregulated molecules were sorted via their respective activation z-score and the top ten regulators (up and down) are presented for each condition. b, c Representative regulatory networks for putative upstream mediators associated with young TBI and aged TBI, with CCL2 representing an upregulated response and GPX1 representing a downregulated response. Both CCL2 and GPX1 show dissimilar expression responses for young TBI versus aged TBI