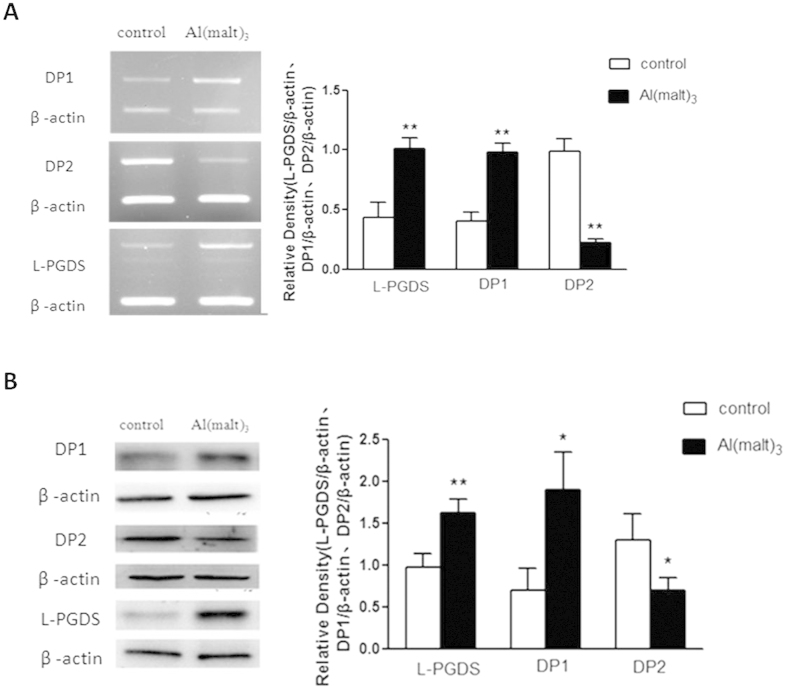
Figure 3. Levels of DP1, DP2 and L-PGDS in primary cultured rat hippocampal neurons detected by reverse transcription polymerase chain reaction.
(A) The expressions of L-PGDS, DPs mRNA were measured by RT-PCR. The relative mRNA level of L-PGDS, DPs were standardized to endogenous β-actin mRNA for each sample. Al administration caused the significant increase of L-PGDS, DP1 levels and decrease of DP2 level compared with the control group. (B) The expressions of L-PGDS, DPs proteins were measured by WB. The relative protein levels of L-PGDS, DPs were standardized to endogenous β-actin protein for each sample. Al administration caused the significant increase of L-PGDS, DP1 levels and decrease of DP2 level compared with the control group. Values were mean ± SD (n = 3, **P < 0.01 vs. control group, one-way ANOVA with Dunnett’s multiple comparisons).

