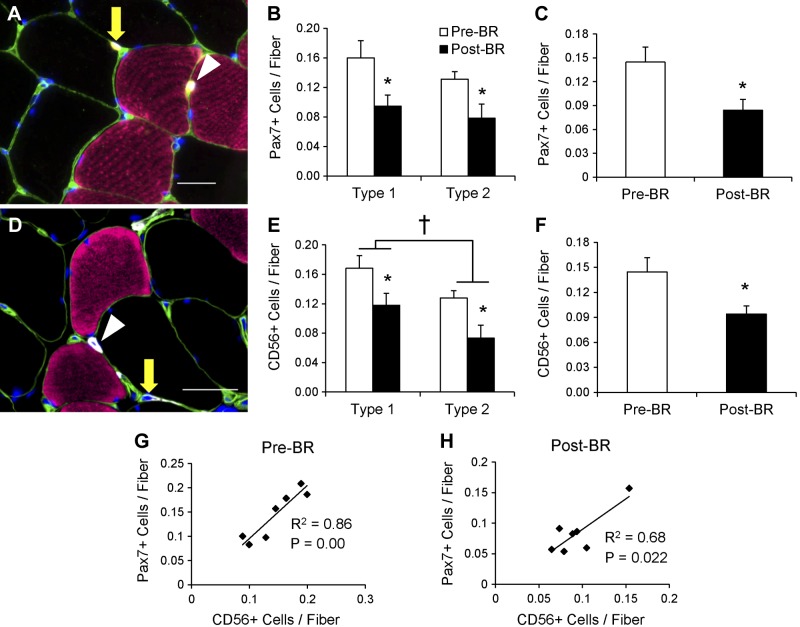
Fig. 4.
Satellite cells associated with MyHC type 1 and 2 fibers decrease following 14 days of bed rest. A: representative immunohistochemical image demonstrating laminin (green), MyHC type 1 (pink), Pax7 (yellow), and DAPI (blue). Pax7-positive satellite cells associated with MyHC type 1 fiber (white arrowhead) and MyHC type 2 fiber (yellow arrow) are identified. Scale bar = 25 μm. B: quantification of fiber type-specific Pax7-positive satellite cell content, expressed as mean satellite cells per fiber ± SE. C: quantification of Pax7-positive satellite cell content, expressed as mean satellite cells per fiber ± SE. D: representative immunohistochemical image demonstrating laminin (green), MyHC type 1 (pink), CD56 (white), and DAPI (blue). CD56-positive satellite cells associated with MyHC type 1 fiber (white arrowhead) and MyHC type 2 fiber (yellow arrow) are identified. Scale bar = 50 μm. E: quantification of fiber type-specific CD56-positive satellite cell content, expressed as mean satellite cells per fiber ± SE. F: quantification of CD56-positive satellite cell content, expressed as mean satellite cells per fiber ± SE. G: correlation of Pre-BR CD56-positive satellite cell content with Pre-BR Pax7-positive satellite cell content. H: correlation of Post-BR CD56-positive satellite cell content with Post-BR Pax7-positive satellite cell content. *Significantly different from Pre-BR value (P < 0.05). †Main effect for fiber type (P < 0.05).

