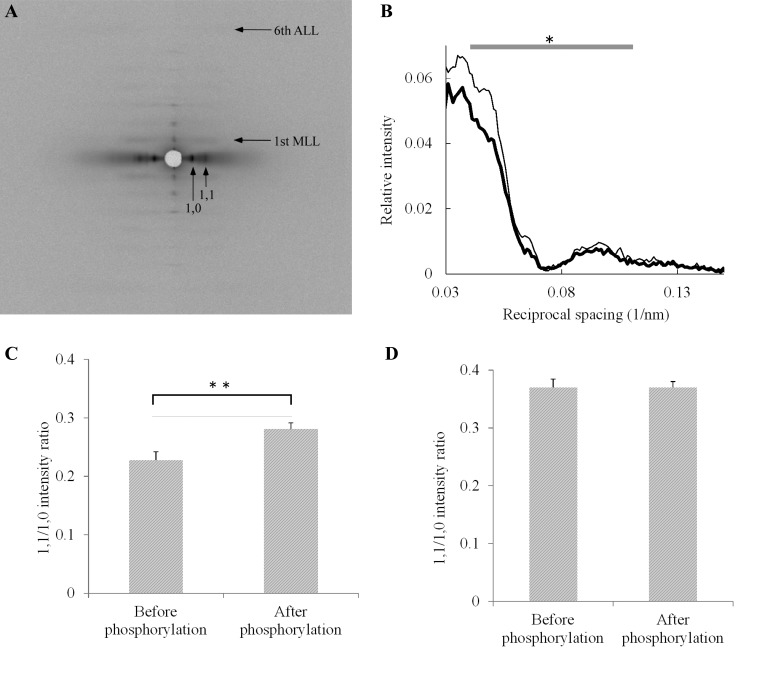
Fig. 3.
Changes in diffraction patterns of fiber bundles in response to RLC phosphorylation. A: representative composite image of 2-D X-ray diffraction patterns obtained before (left half) and after (right half) phosphorylation. Horizontal arrows point to first myosin layer line (MLL) and the sixth actin layer line (ALL). Vertical arrows point to the equatorial (1,0) and (1,1) reflections. B: averaged profiles of the first MLL before (thin line, n = 9) and after (thick line, n = 9) phosphorylation. MLL intensity is presented relative to the integrated intensity of the sixth ALL (at 5.9 nm−1). The integral of the averaged intensity from 0.040 to 0.11 nm−1 in reciprocal equatorial spacing was significantly lower after phosphorylation (*P < 0.05, t-test). Fiber bundles were obtained from the same rabbit, and the sarcomere lengths of the fibers were within the range of 1.9 to 2.6 μm. C: mean equatorial (1,1/1,0) intensity ratios at short sarcomere lengths before (n = 12) and after (n = 11) phosphorylation. Bars represent standard errors of the mean (SE). The increase in mean (1,1/1,0) intensity ratio after phosphorylation is statistically significant (**P < 0.01, t-test). Sarcomere lengths were within the range of 1.9 to 2.2 μm. The (1,0) lattice spacing (means ± SE) was not significantly different before (41.6 ± 0.26 nm) and after (42.0 ± 0.39 nm) phosphorylation. Fiber bundles were obtained from the same rabbit. D: mean equatorial (1,1/1,0) intensity ratios at long sarcomere lengths before (n = 5) and after (n = 5) phosphorylation. Bars represent SE. The ratios were not significantly different (P > 0.05, t-test). Sarcomere lengths were within the range of 2.35 to 2.6 μm. The (1,0) lattice spacing (means ± SE) was not significantly different before (40.8 ± 0.19 nm) and after (40.6 ± 0.33 nm) phosphorylation. Fiber bundles were obtained from the same rabbit.

