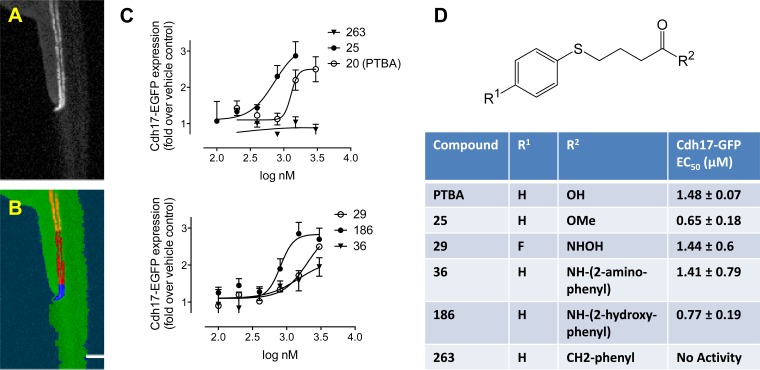
Fig. 1.
Quantitation of kidney organ expansion by automated imaging. Tg(chd17:EGFP) transgenic zebrafish (A) were treated for 48 h at the 256–512 cell stage with vehicle (0.5% DMSO) or specified compounds, followed by washout. At 72-h postfertilization (hpf), embryos were dechorionated and imaged in 96-well plates (8 embryos/condition). Images were acquired in the green fluorescent protein (GFP) channel and analyzed by a Definiens Cognition Network Technology (CNT) rule set. Starting from the original image (A), the rule set successively detected the entire embryo and the fluorescently labeled kidney (B, orange). Further subsegmentation identified the cloaca based on brightness and proximity to the zebrafish edge (B, blue), enabling final measurements to be made in a defined length segment relative to the cloaca (B, red). C: quantitation of kidney expansion by UPHD20, 25, 29, 36, 186, and 263. Images were analyzed by CNT, and total transgene expression in the tubular segment was calculated. Each data point represents the average ± SE of 3 independent experiments. D: structure of 4-(phenylthio)butanoic acid (PTBA) analogs with sites of modification (R1 and R2) and EC50 for compounds UPHD20 (PTBA), 25, 29, 36, 186, and 263.

