
Fig. 10.
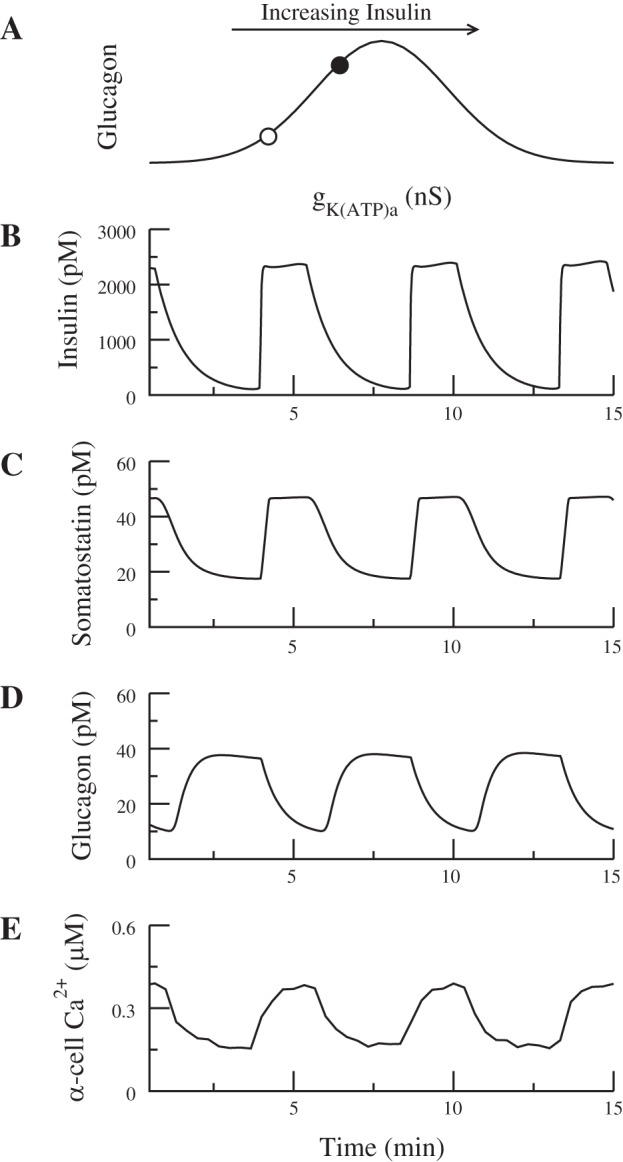
A: in elevated glucose, the α-cell is assumed to have gKATPa on the left side of the schematic bell-shaped dose-response curve (○); insulin increases α-cell Ca2+ by increasing gKATPa (●). B and C: in-phase insulin and somatostatin secretion. D and E: somatostatin suppresses glucagon secretion by a direct effect on exocytosis, which trumps the rise in Ca2+ so that glucagon is anti-phase with insulin. In this simulation, ka = 0.0148, ra = 5, = 7,000 pS, and gKATPd = 0.26 nS. As insulin oscillates, gKATPa varies between 0.04 and 0.08 nS (compare with Fig. 2A).