Figure 3.

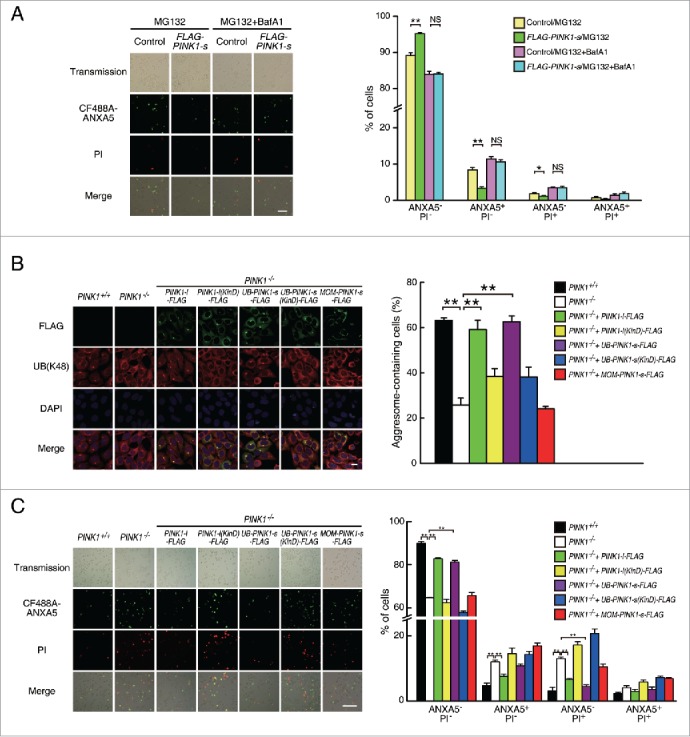
Cytosolic PINK1-s protects cells from proteasomal stress-induced cell death. (A) Cell death analysis of AD293 (control) and AD293 (FLAG-PINK1-s) cells after a 20-h treatment with MG132 (1 μM) or MG132 (1 μM)/BafA1 (100 nM). Cells were stained with CF488A-ANXA5 (green) and propidium iodide (PI, red) to detect dead cells. Live Cells, ANXA5− PI−; early apoptotic cells, ANXA5+PI−; necrotic cells, ANXA5−PI+; late apoptotic cells, ANXA5+PI+. Scale bar: 100 μm. Quantification results are shown as mean±SEM of 3 independent experiments. *, P < 0.05; **, P < 0.01. (B) Aggresome formation in PINK1+/+, PINK1−/− and its rescue cell lines after a 14-h treatment with MG132 (1.5 μM). UB-containing aggresomes and exogenous PINK1 were detected by immunofluorescence staining with UB(K48) and FLAG antibodies, respectively. The nuclei were detected by DAPI staining. Scale bar: 20 μm. Quantification results are shown as mean±SEM of 3 independent experiments. **, P < 0.01. (C) Cell death analysis of PINK1+/+, PINK1−/− and the rescue cell lines after a 20-h treatment with MG132 (1 μM). Cells were stained with CF488A-ANXA5 (green) and propidium iodide (PI, red) to detect dead cells. Live Cells, ANXA−PI−; early apoptotic cells, ANXA5+PI−; necrotic cells, ANXA5−PI+; late apoptotic cells, ANXA5+ PI+. Scale bar: 100 μm. Quantification results are shown as mean±SEM of 3 independent experiments. **, P < 0.01.
