
Figure 9.
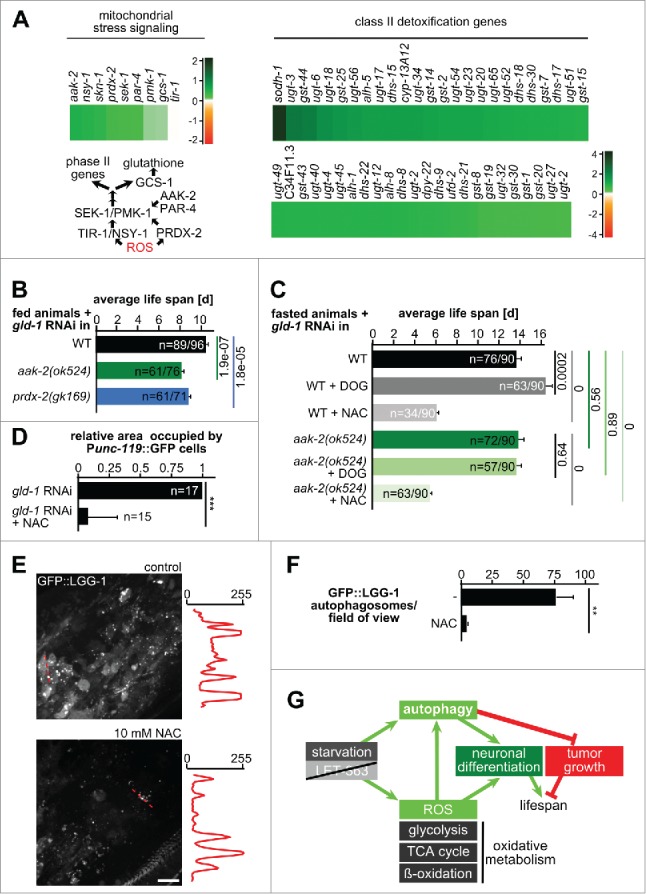
Mitochondrial stress signaling is induced during fasting and is required for fasting-induced tumor survival and autophagy. (A) Top left: Changes in transcript levels in regulators implicated in mitochondrial ROS signaling. log2-fold changes between fasting and feeding are shown. Bottom left: Model of mitochondrial ROS signaling. Right: Changes in transcript levels of class II detoxification genes. log2-fold changes between fasting and feeding are shown. (B) Life-span analysis under feeding conditions. Number of animals and Mantel-Cox test P values are shown. (C) Life-span analysis under fasting conditions. Number of animals and Mantel-Cox test P values are shown. (D) Quantification of neuronal differentiation in gld-1 germline tumors with and without NAC. (E) Changes in autophagosomes in control and NAC-treated gld-1 RNAi animals. Left: Representative z-projections of central germline tumor regions. Line scans of greyscale values along the dashed red lines in the projections are shown on the right side of each projection. Scale bar: 10 μm. (F) Quantification of autophagosome numbers; n = 3 animals each; **P ≤ 0.01. (G) Model showing the pathways contributing to tumor cell growth and differentiation. See discussion for details. Scale bar: 10 μm.