Figure 3.
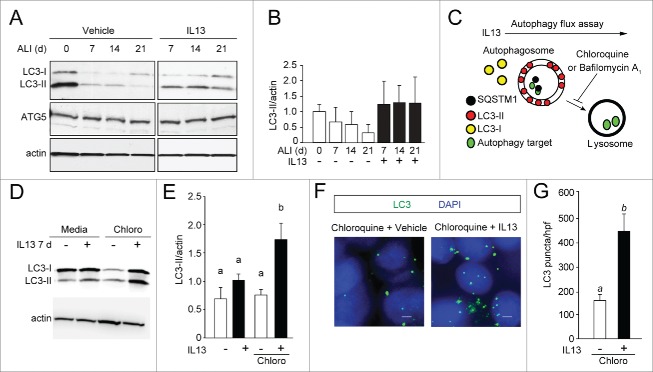
IL13 increases autophagy activity. (A) hTEC were cultured in the presence of vehicle or IL13 for 21 d of ALI conditions. Cell lysates were prepared at the indicated time points of ALI culture for immunoblot analysis for ATG5 and LC3. Representative blots are shown. (B) Quantification of immunoblot density of the LC3-II to actin ratio as the mean ±SEM (n = 3 independent experiments each from a preparation of a unique cell donor). (C) Autophagy flux assay to determine the influence of IL13 on autophagy activity in hTEC. (D) Representative LC3-immunoblots of hTEC incubated with vehicle (−) or IL13 (+) for 7 d then treated with chloroquine (Chloro) as shown in (C). Lysates were harvested at ALI 21. (E) Immunoblot image densities of LC3-II to actin ratios shown as the mean ±SEM (n = 5 independent experiments). Mean LC3 to actin band densities with different letters are significantly different by ANOVA with Bonferroni's correction. (F) Representative images of LC3 puncta in hTEC (E) in the presence or absence of IL13 for 7 d, on ALI d 14–21, then treated with chloroquine as shown in (C). Scale bar: 10 μm. (G) Quantification of the number of LC3 puncta as mean ±SEM from triplicate values per high-powered field (hpf) obtained from photomicrographs for each experiment (n = 3 independent experiments). Means with different letters are significantly different by unpaired 2-tailed Student t test.

