Figure 1.

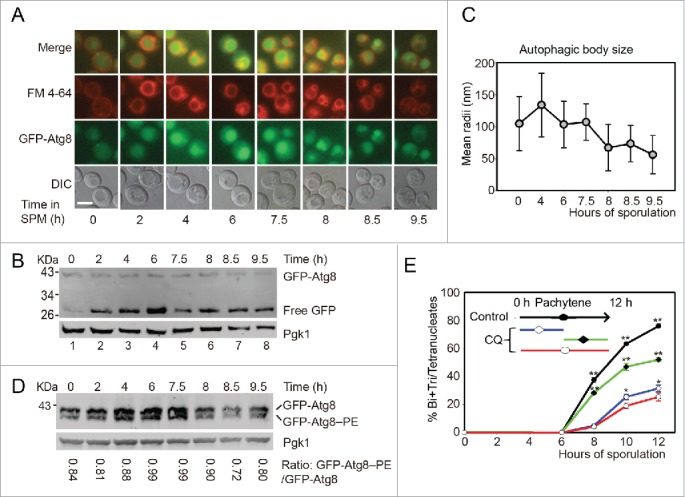
Autophagy mainly participates in the initial stage of yeast meiosis. (A) GFP-Atg8 localization during meiosis. The p1K-GFP-ATG8 plasmid under the control of the ATG8 promoter was introduced into the SK1 background strain. Cells were labeled with FM 4–64 for 5 min then transferred into SPM for sporulation. Samples were collected at different time points and washed 3 times with PBS, then immediately observed by fluorescence microscopy. Scale bar: 5 μm. DIC, differential interference contrast. (B) GFP-Atg8 processing during meiosis. Yeast cells harboring the p1K-GFP-ATG8 plasmid were sporulated and collected from different sporulation time points, and used to generate protein extracts; GFP-Atg8 and free GFP were detected by western blotting with anti-GFP antibody. Lanes 1–8 represent samples at 0, 2, 4, 6, 7.5, 8, 8.5, and 9.5 h in SPM, respectively. (C) Estimation of autophagic body size formed at the indicated sporulation time points. The autophagic body size estimation was followed by a protocol described in the methods. The error bars were the standard deviation (SD) of the radius. (D) GFP-Atg8–PE conjugation during meiosis. The p1K-GFP-ATG8 plasmid was introduced into the SK1 background pep4Δ strain. After sporulation and sample collection, the PE conjugated (GFP-Atg8–PE) and unconjugated (GFP-Atg8) forms were detected by western blotting with anti-GFP antibody. The ratios of conjugated and unconjugated GFP-Atg8 are shown on the bottom of each lane. (E) Effect of CQ treatment on yeast sporulation at different meiotic stages. 200 mM CQ was added into SPM at 0 h then cells were washed with fresh SPM after 5 h (blue line) induction, or CQ was added after 5 h induction (green line). The red line shows the sporulation rate of cells treated with CQ from 0 h to 12 h. Data are presented as the mean ± SD. Asterisk indicates statistically significant difference in comparison with the 0–12 h treated samples. *, P < 0 .05; **, P < 0 .01.
