
Figure 3.
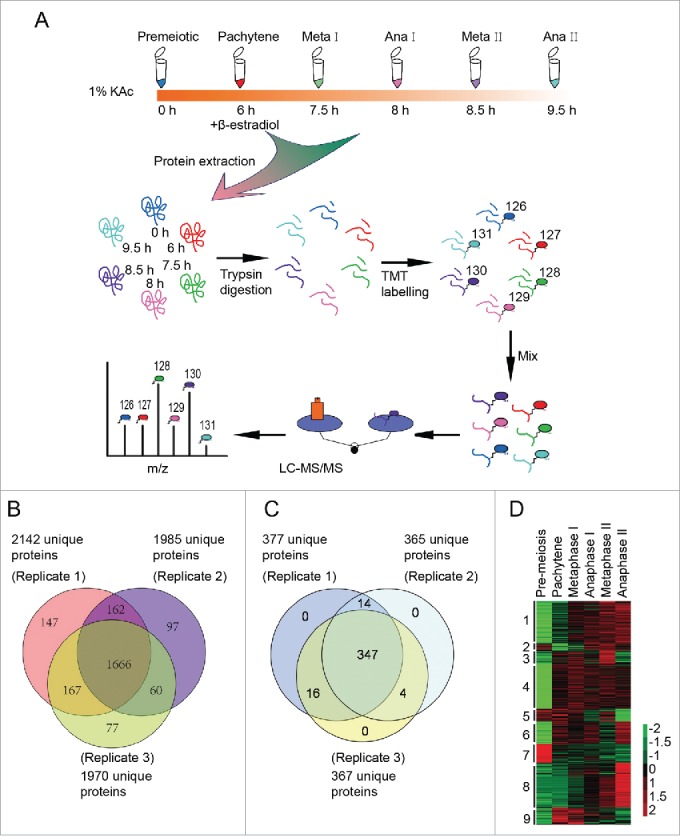
Three hundred eighty one differentially expressed proteins during meiosis were identified by quantitative proteomics. (A) Workflow of the proteomic study of yeast meiosis. Yeast cells (A14201) were induced to sporulate at 30°C by transferring into SPM. After 6 h, 1 μM β-estradiol was added. Samples were collected at 0, 6, 7.5, 8, 8.5, and 9.5 h, and proteins were extracted. After trypsin digestion, peptides were labeled with isobaric TMT and mixed in equal ratios. The labeled mixture was then subjected to an orthogonal first-dimension separation with SCX. Seventeen fractions were subsequently analyzed on an LTQ Orbitrap Velos mass spectrometer coupled with nano-RP HPLC. Biological replicates were performed in triplicate. The spectra were analyzed with MaxQuant software. (B) Protein identification across the 3 biological replicates. (C) Venn plot of 381 differentially regulated proteins. (D) Cluster analysis of 381 differentially expressed proteins. All MS data were normalized and then analyzed for cluster analysis. Cluster results were visualized by TreeView software.