Figure 4.

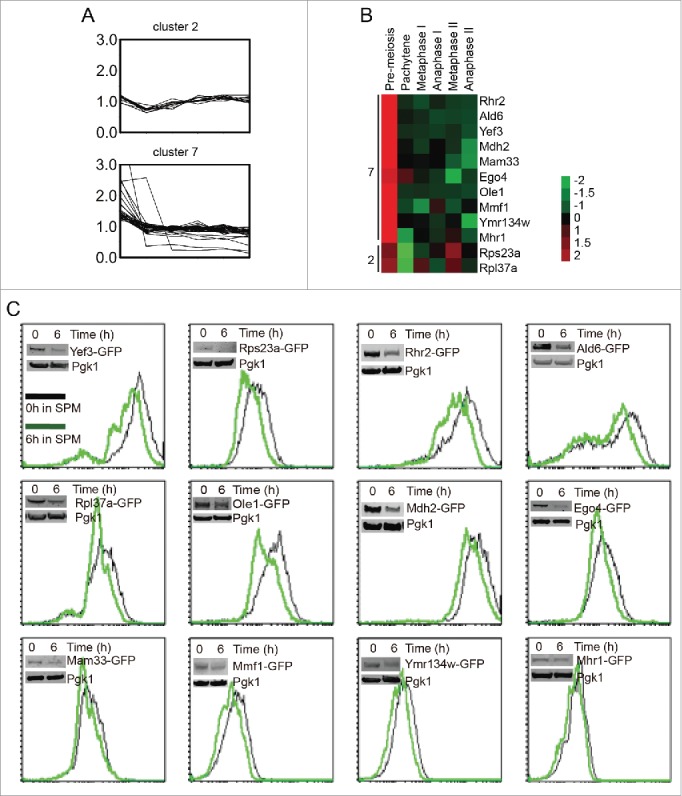
Pachytene stage downregulation of cluster 2 and cluster 7 proteins. (A) The expression pattern of cluster 2 and cluster 7 proteins during meiosis. (B). The expression patterns of 12 selected proteins from cluster 2 and cluster 7. The expression values of each protein were normalized across time points to have an average value of 0 and a standard deviation of 1, to better show the expression trend in color mode. (C) The selected genes were fused with GFP on their C-termini, and the intensity of GFP represented the amount of those proteins. Yeast cells were collected and fixed at 0 h and 6 h after transfer into SPM, then analyzed by flow cytometry and western blotting. Most of the flow cytometry and western blotting results were consistent with the MS data.
