Figure 6.

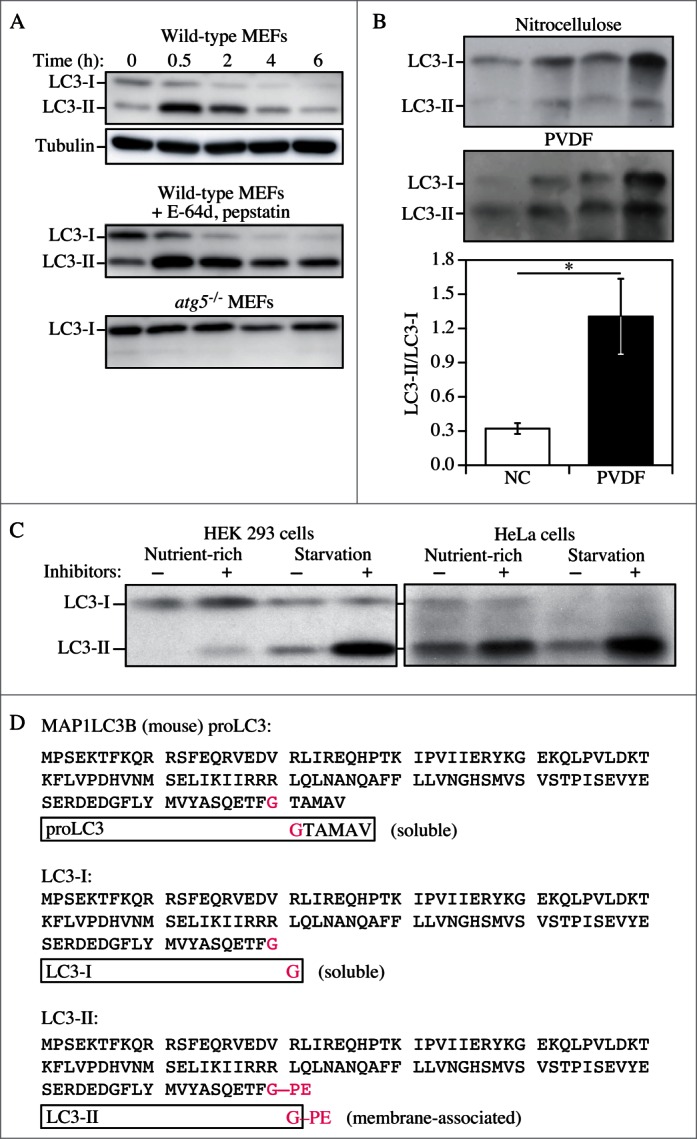
LC3-I conversion and LC3-II turnover. (A) Expression levels of LC3-I and LC3-II during starvation. Atg5+/+ (wild-type) and atg5-/- MEFs were cultured in DMEM without amino acids and serum for the indicated times, and then subjected to immunoblot analysis using anti-LC3 antibody and anti-tubulin antibody. E-64d (10 μg/ml) and pepstatin A (10 μg/ml) were added to the medium where indicated. Positions of LC3-I and LC3-II are marked. The inclusion of lysosomal protease inhibitors reveals that the apparent decrease in LC3-II is due to lysosomal degradation as easily seen by comparing samples with and without inhibitors at the same time points (the overall decrease seen in the presence of inhibitors may reflect decreasing effectiveness of the inhibitors over time). Monitoring autophagy by following steady state amounts of LC3-II without including inhibitors in the analysis can result in an incorrect interpretation that autophagy is not taking place (due to the apparent absence of LC3-II). Conversely, if there are high levels of LC3-II but there is no change in the presence of inhibitors, this may indicate that induction has occurred but that the final steps of autophagy are blocked, resulting in stabilization of this protein. This figure was modified from data previously published in ref. 26, and is reproduced by permission of Landes Bioscience, copyright 2007. (B) Lysates of 4 human adipose tissue biopsies were resolved on 2-12% polyacrylamide gels, as described previously.217 Proteins were transferred in parallel to either a PVDF or a nitrocellulose membrane, and blotted with anti-LC3 antibody, and then identified by reacting the membranes with an HRP-conjugated anti-rabbit IgG antibody, followed by ECL. The LC3-II/LC3-I ratio was calculated based on densitometry analysis of both bands. *, P < 0.05. (C) HEK 293 and HeLa cells were cultured in nutrient-rich medium (DMEM containing 10% fetal calf serum) or incubated for 4 h in starvation conditions (Krebs-Ringer medium) in the absence (−) or presence (+) of E-64d and pepstatin at 10 μg/ml each (Inhibitors). Cells were then lysed and the proteins resolved by SDS-PAGE. Endogenous LC3 was detected by immunoblotting. Positions of LC3-I and LC3-II are indicated. In the absence of lysosomal protease inhibitors, starvation results in a modest increase (HEK 293 cells) or even a decrease (HeLa cells) in the amount of LC3-II. The use of inhibitors reveals that this apparent decrease is due to lysosome-dependent degradation. This figure was modified from data previously published in ref. 174, and is reproduced by permission of Landes Bioscience, copyright 2005. (D) Sequence and schematic representation of the different forms of LC3B. The sequence for the nascent (proLC3) from mouse is shown. The glycine at position 120 indicates the cleavage site for ATG4. After this cleavage, the truncated LC3 is referred to as LC3-I, which is still a soluble form of the protein. Conjugation to PE generates the membrane-associated LC3-II form (equivalent to Atg8–PE).
