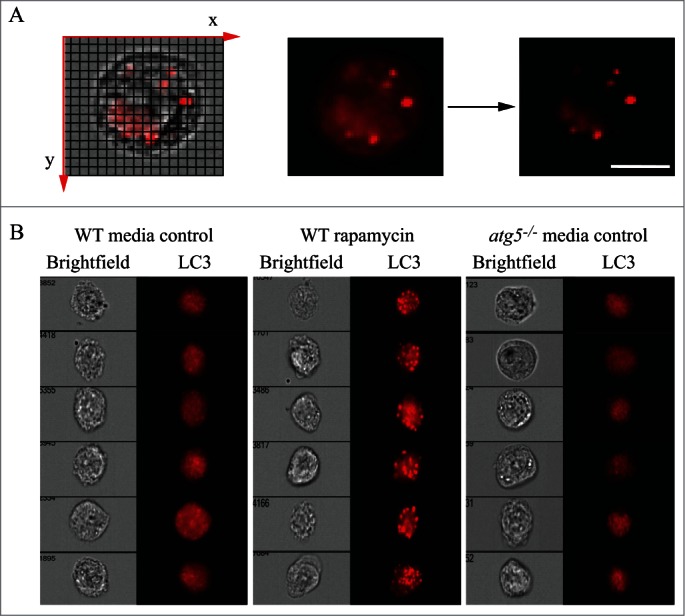
Figure 14.

Assessing autophagy with multispectral imaging cytometry. (A) Bright Detail Intensity (BDI) measures the foreground intensity of bright puncta (that are 3 pixels or less) within the cell image. For each cell, the local background around the spots is removed before intensity calculation. Thus, autophagic cells with puncta have higher BDI values. (B) Media control (untreated wild type), rapamycin-treated wild-type and atg5-/- MEFs were gated based on BDI. Representative images of cells with high or low BDI values. Scale bar: 10 µm. Images provided by M.L. Albert.
