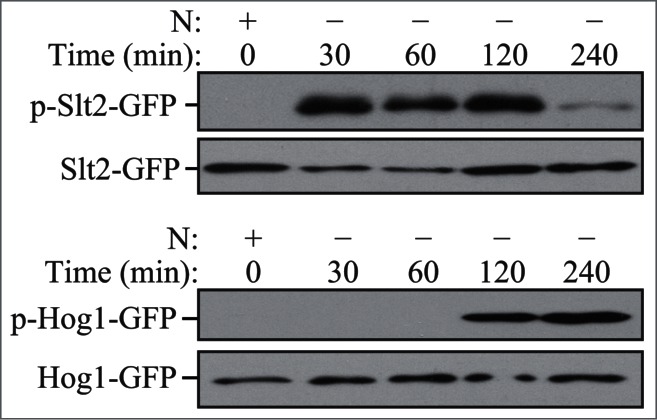
Figure 20.

S. cerevisae cells were cultured to mid-log phase and shifted to SD-N for the indicated times. Samples were taken before (+) and at the indicated times after (–) nitrogen starvation. Immunoblotting was done with anti-phospho-Slt2 and anti-phospho-Hog1 antibody. This figure was modified from data previously published in ref. 508, and is reproduced by permission of the American Society for Cell Biology, copyright 2011.
