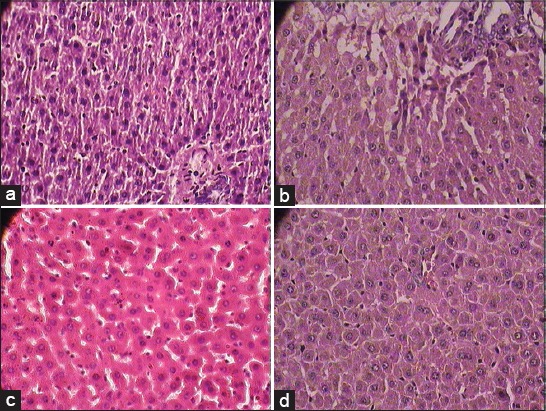
Figure 1.

(a) Normal cytoarchitecture of liver in normal control group (1 × 400 magnification), (b) Photomicrographs of representative section of Liver. Macro and micro fatty changes, cell infiltration in almost all the sections streptozotocin control group (1 × 400 magnification) (c) Shadguna Balijarita Makaradhwaja treated rats shows almost normal cytoarchitecture of liver in comparison with streptozotocin control group diabetic rats (1 × 400 magnification), (d) Glibenclamide treated rat showed almost normal cytoarchitecture of liver sections in comparison with streptozotocin control group diabetic rats (1 × 400 magnification)
