
Figure 6.
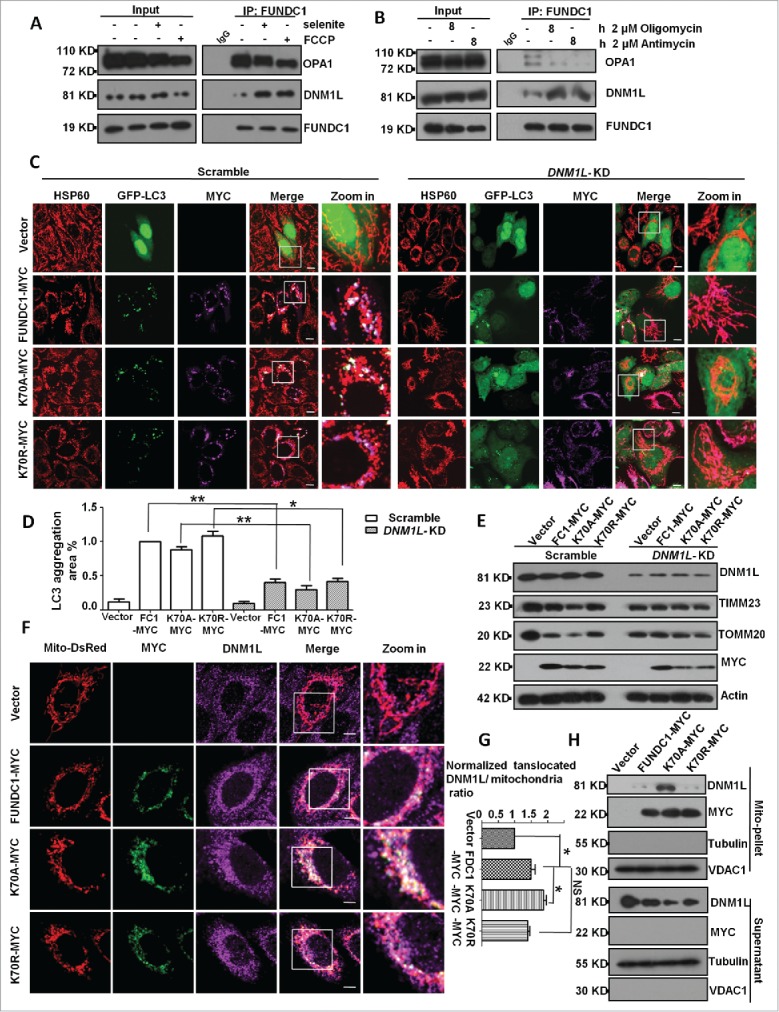
FUNDC1 cooperates with OPA1 and DNM1L for mitochondrial fragmentation and mitophagy. (A) HeLa cells were treated with 10 µM selenite or 10 µM FCCP for 3 h. The cells were then subjected to immunoprecipitation with an anti-FUNDC1 antibody. The immune complex was analyzed by western blotting. (B) Hela cells were treated with 2 µM oligomycin or 2 µM antimycin for 8 h. The cells were then subjected to CoIP with an anti-FUNDC1 antibody. The immune complexes were detected by western blotting. (C) Scrambled shRNA-treated and DNM1L knockdown cells were transfected with FUNDC1 or FUNDC1 mutants and GFP-LC3, and then fixed and immunostained for HSP60 (red) and MYC (purple). Scale bar: 10 µm. (D) The GFP-LC3 aggregates in cells treated as in (C) were quantified with imageJ. The GFP-LC3 aggregation area vs. whole cell area was used to indicate the GFP-LC3 aggregation ratio (mean+/−SEM; n = 100 cells from 3 independent experiments; *, P < 0 .05; **, P < 0 .01). (E) Cells were transfected by FUNDC1 (wild type and mutants), and then subjected to western blotting. (F) HeLa cells were transfected with FUNDC1 or FUNDC1 mutants and mito-DsRed for 24 h and then fixed and immunostained to detect MYC (green) and DNM1L (purple). Scale bar: 10 µm. (G) The proportion of translocated DNM1L in (F) was quantified with imageJ by measuring DNM1L (purple) mitochondria (red) merged area and mitochondria area (red), the merged area vs. whole mitochondrial area was used to indicate the translocated DNM1L. The ratio was normalized to cells transfected with shRNA vector plasmids (mean+/−SEM; n = 100 cells from 3 independent experiments; *, P < 0 .05). (H) HeLa cells were subfractionated to detect DNM1L translocation from the cytosol fraction to mitochondrial pellets in the treatment in (F).