
Fig. 4.
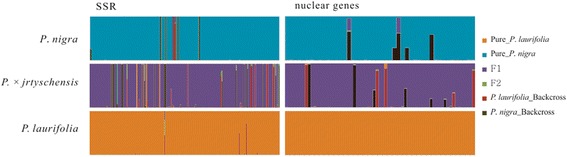
Estimated posterior probabilities for each individual being pure parents, F1, F2 and backcross genotypes. The height of the column for each individual represents the probability of a single frequency class. An individual was considered assigned if the probability of a single frequency class exceeded 90 %