Fig. 6.

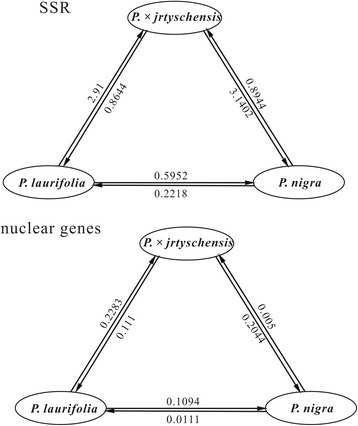
Gene flow for all three species pairs. Gene flow for all three species pairs is represented by arrows. Figures beside the arrows indicate the population migration rate (Nem)

Gene flow for all three species pairs. Gene flow for all three species pairs is represented by arrows. Figures beside the arrows indicate the population migration rate (Nem)