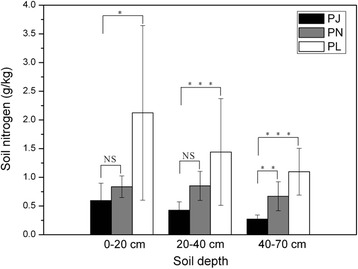
Fig. 7.

Comparisons of soil nitrogen concentration at each depth for the three taxa’s sites. Error bars represent SE. PJ, P. × jrtyschensis; PN, P. nigra; and PL, P. laurifolia. Significant differences in soil nitrogen concentration at each depth for the sites representing the habitat of each of the three taxa as revealed by ANOVA: NS not significant, P > 0.1; *P < 0.05; **P < 0.01; ***P < 0.001
