Fig. 1.

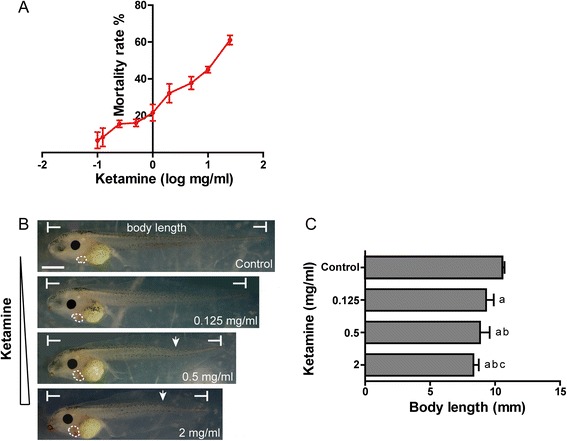
The effect of ketamine on embryos at stage 46. a Mortality rate of increasing concentrations of ketamine (0.1, 0.125, 0.25, 0.5, 1, 2, 5, 10, 25 mg/ml). b Malformations at three exposure concentrations of ketamine (0.125, 0.5, 2 mg/ml). Hearts are marked by white punctiform curves. The arrowhead indicates a curved axis. Scale bar = 100 μm. c Comparison of body lengths at three exposure concentrations. a P < 0.05 vs. control group; b P < 0.05 vs. 0.125 mg/ml ketamine-treated group; c P < 0.05 vs. 0.5 mg/ml ketamine-treated group. The data represent the means ± SD
