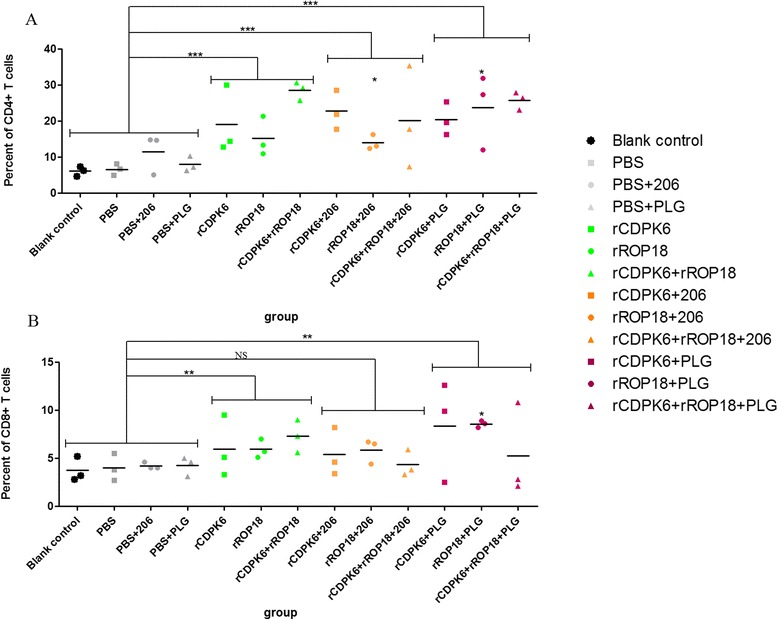
Fig. 4.

Percentages of T-cell subsets (a CD4+; b CD8+ T cells) in immunized mice. The 4 control groups, PBS + PLG, PBS + 206, PBS and blank control, were treated as controls in statistical analysis. The P value was calculated using the measurements from each immunized group to compare with the average from controls. Furthermore, the proteins + PLG, proteins + 206 and proteins alone were respectively treated as a group compared with the average from controls. **P < 0.01. *** P < 0.001. NS: not significant
