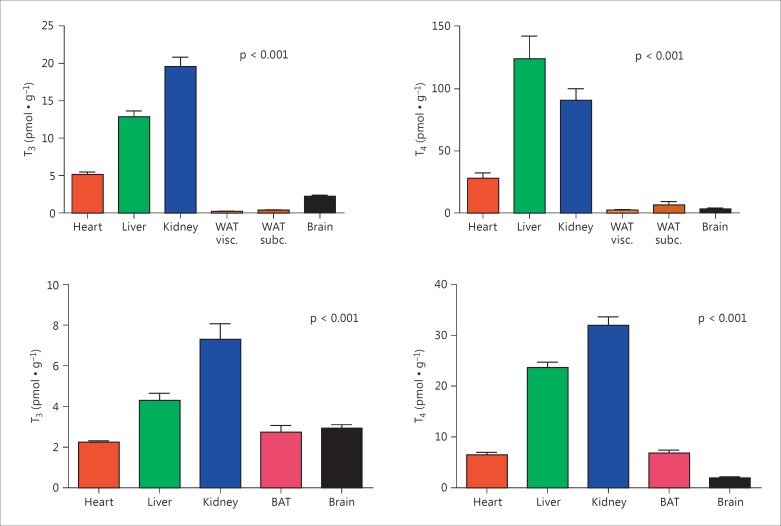
Fig. 1.
The upper panels show the distribution of tissue T3 and T4 in control animals. The lower panels reproduce the results obtained by Escobar-Morreale et al. [13], calculated from table 1 of their paper. WAT = White adipose tissue; BAT = brown adipose tissue. Bars represent means ± SEM of 3-8 hearts per group. Statistical significance refers to differences between groups and was calculated by one-way ANOVA. Pairwise group comparisons performed on the results of the present investigation (upper panels) by Tukey's post hoc test showed that both the differences between WAT (either visceral or subcutaneous) and brain were not statistically significant for T3 and for T4, while all other comparisons between pairs of groups yielded p < 0.05.

