Fig. 3.

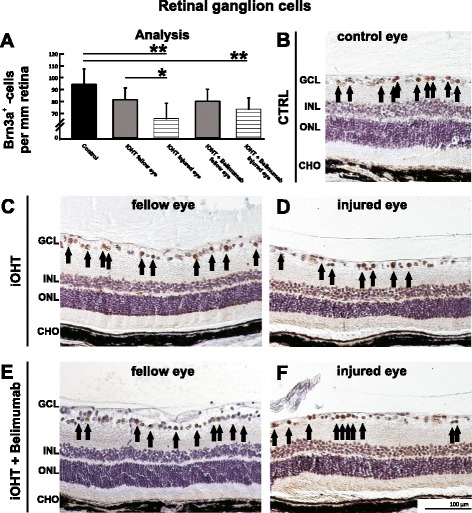
Retinal ganglion cell analysis. a The survival of retinal ganglion cells was analyzed as the number of Brn3a-positive cells per mm retina in naso-temporal cross-sections of the eye. A significant loss of retinal ganglion cells was observed in injured eyes of iOHT group and iOHT + Belimumab group (both p < 0.01, horizontal lines) compared with control eyes (black). Furthermore, a significant difference in damage was observed between fellow and injured eye of iOHT group (p < 0.05), but not between both eyes of iOHT + Belimumab group (p = 0.8). Significant values are indicated as follows: *p < 0.05, **p < 0.01. b–f Representative images of retinal cross-sections (×20 magnification) show different densities of Brn3a-positive cells (arrows) in controls (CTRL, b), fellow and injured eyes of iOHT group (c and d, respectively), and fellow and injured eyes of iOHT + Belimumab group (e and f, respectively). Images were taken at the same eccentricity to the optic nerve head to ensure comparability. Note the low number of retinal ganglion cells in injured eyes. Abbreviations: GCL ganglion cell layer, INL inner nuclear layer, ONL outer nuclear layer, CHO choroid. Scale bar represents 100 μm. Significant values are indicated as follows: *p < 0.05, **p < 0.01
